Check out other books by Al Sweigart, free online or available for purchase:
...and other books as well! Or register for the online video course. You can also donate to support the author directly.
21 MAKING GRAPHS AND MANIPULATING IMAGES
If you own a digital camera or upload photos from your phone to a social media site, you probably cross paths with digital image files all the time. You may know how to use basic graphics software such as Microsoft Paint or Paintbrush, or even more advanced applications such as Adobe Photoshop. But if you need to edit a massive number of images, altering them by hand can be a lengthy, boring job.
Enter Pillow, a third-party Python package for interacting with image files. This package has several functions that make cropping, resizing, and editing the content of an image easy. This chapter covers the use of Pillow to enable Python to automatically edit hundreds or thousands of images with ease.
This chapter also covers Matplotlib, a popular library for making professional-looking graphs. Matplotlib is rich in features and customizable options, and there are many books entirely dedicated to it. Here, we’ll cover the basics of generating graph images with Matplotlib.
Computer Image Fundamentals
To manipulate an image, you must understand how to work with colors and coordinates in Pillow. You can install the latest version of Pillow by following the instructions in Appendix A.
Colors and RGBA Values
Computer programs often represent a color in an image as an RGBA value, a group of numbers that specify the amount of red, green, blue, and alpha (or transparency) to include. Each of these component values is an integer ranging from 0 (none at all) to 255 (the maximum). These RGBA values belong to individual pixels, the smallest dot of a single color the computer screen can show. A pixel’s RGB setting tells it precisely what shade of color it should display. If an image on the screen is superimposed over a background image or desktop wallpaper, the alpha value determines how much of the background you can “see through” the image’s pixel.
Pillow represents RGBA values using a tuple of four integer values. For example, it represents the color red with (255, 0, 0, 255). This color has the maximum amount of red, no green or blue, and the maximum alpha value, meaning it’s fully opaque. Pillow represents green with (0, 255, 0, 255) and blue with (0, 0, 255, 255). White, the combination of all colors, is (255, 255, 255, 255), while black, which has no color at all, is (0, 0, 0, 255).
If a color has an alpha value of 0, it is invisible, and it doesn’t really matter what the RGB values are. After all, invisible red looks the same as invisible black.
Pillow uses the same standard color names as HTML. Table 21-1 lists a selection of standard color names and their values.
Name |
RGBA value |
Name |
RGBA value |
|
|---|---|---|---|---|
White |
(255, 255, 255, 255) |
Red |
(255, 0, 0, 255) |
|
Green |
(0, 255, 0, 255) |
Blue |
(0, 0, 255, 255) |
|
Gray |
(128, 128, 128, 255) |
Yellow |
(255, 255, 0, 255) |
|
Black |
(0, 0, 0, 255) |
Purple |
(128, 0, 128, 255) |
Pillow offers the ImageColor.getcolor() function so that you don’t have to memorize RGBA values for the colors you want to use. This function takes a color name string as its first argument and the string 'RGBA' as its second argument, and it returns an RGBA tuple. To see how this function works, enter the following into the interactive shell:
❶ >>> from PIL import ImageColor
❷ >>> ImageColor.getcolor('red', 'RGBA')
(255, 0, 0, 255)
❸ >>> ImageColor.getcolor('RED', 'RGBA')
(255, 0, 0, 255)
>>> ImageColor.getcolor('Black', 'RGBA')
(0, 0, 0, 255)
>>> ImageColor.getcolor('chocolate', 'RGBA')
(210, 105, 30, 255)
>>> ImageColor.getcolor('CornflowerBlue', 'RGBA')
(100, 149, 237, 255)
First, import the ImageColor module from PIL (not from Pillow, due to naming history beyond the scope of this book) ❶. The color name string you pass to ImageColor.getcolor() is case-insensitive, so 'red' ❷ and 'RED' ❸ give you the same RGBA tuple. You can also pass more unusual color names, like 'chocolate' and 'CornflowerBlue'.
Pillow supports a huge number of color names, from 'aliceblue' to 'yellowgreen'. Enter the following into the interactive shell to view the color names:
>>> from PIL import ImageColor
>>> list(ImageColor.colormap)
['aliceblue', 'antiquewhite', 'aqua', ... 'yellow', 'yellowgreen']
You can find the full list of more than 100 standard color names in the keys of the ImageColor.colormap dictionary.
Coordinates and Box Tuples
Image pixels are addressed with x- and y-coordinates, which respectively specify a pixel’s horizontal and vertical locations in an image. The origin is the pixel at the top-left corner of the image and is specified with the notation (0, 0). The first zero represents the x-coordinate, which starts at zero at the origin and increases from left to right. The second zero represents the y-coordinate, which starts at zero at the origin and increases down the image. This bears repeating: y-coordinates increase going downward, which is the opposite of how you may remember y-coordinates being used in math class. Figure 21-1 demonstrates how this coordinate system works.
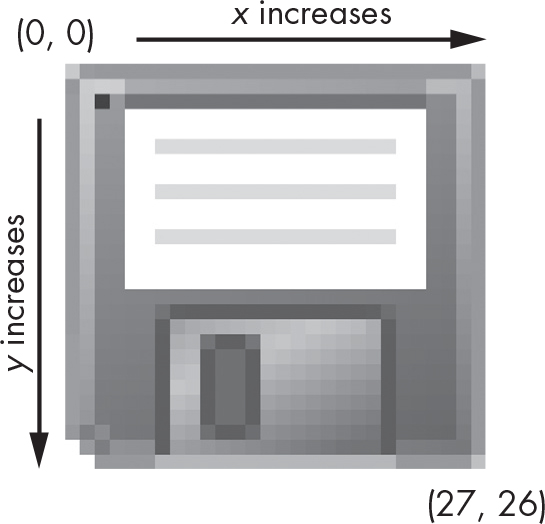
Figure 21-1: The x- and y-coordinates of a 28×27 image of some sort of ancient data storage device
Many of Pillow’s functions and methods take a box tuple argument. This means Pillow is expecting a tuple of four integer coordinates that represent a rectangular region in an image. The four integers are, in order, as follows:
Left The x-coordinate of the leftmost edge of the box.
Top The y-coordinate of the top edge of the box.
Right The x-coordinate of one pixel to the right of the rightmost edge of the box. This integer must be greater than the left integer.
Bottom The y-coordinate of one pixel lower than the bottom edge of the box. This integer must be greater than the top integer.
Note that the box includes the left and top coordinates and goes up to but does not include the right and bottom coordinates. For example, the box tuple (3, 1, 9, 6) represents all the pixels in the black box in Figure 21-2.
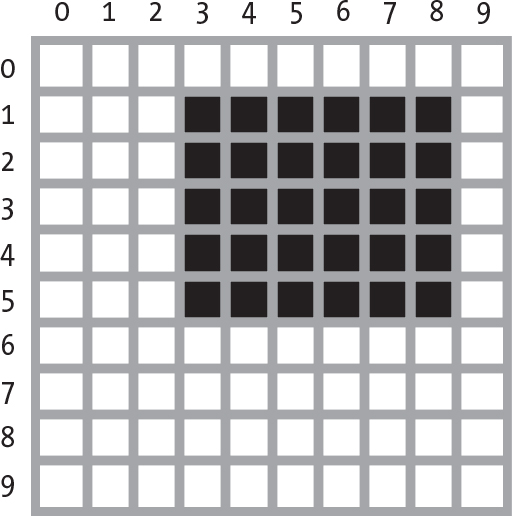
Figure 21-2: The area represented by the box tuple (3, 1, 9, 6)
Now that you know how colors and coordinates work in Pillow, let’s use Pillow to manipulate an image.
Manipulating Images with Pillow
To practice working with Pillow, we’ll use the zophie.png image file shown in Figure 21-3. You can download it from the book’s online resources at https://
>>> from PIL import Image
>>> cat_im = Image.open('zophie.png')
>>> cat_im.show()
Import the Image module from Pillow and call Image.open(), passing it the image’s filename. You can then store the loaded image in a variable like cat_im. Pillow Image objects have a show() method that opens the image in a window. This is useful when you’re debugging your programs and need to identify the image in an Image object.
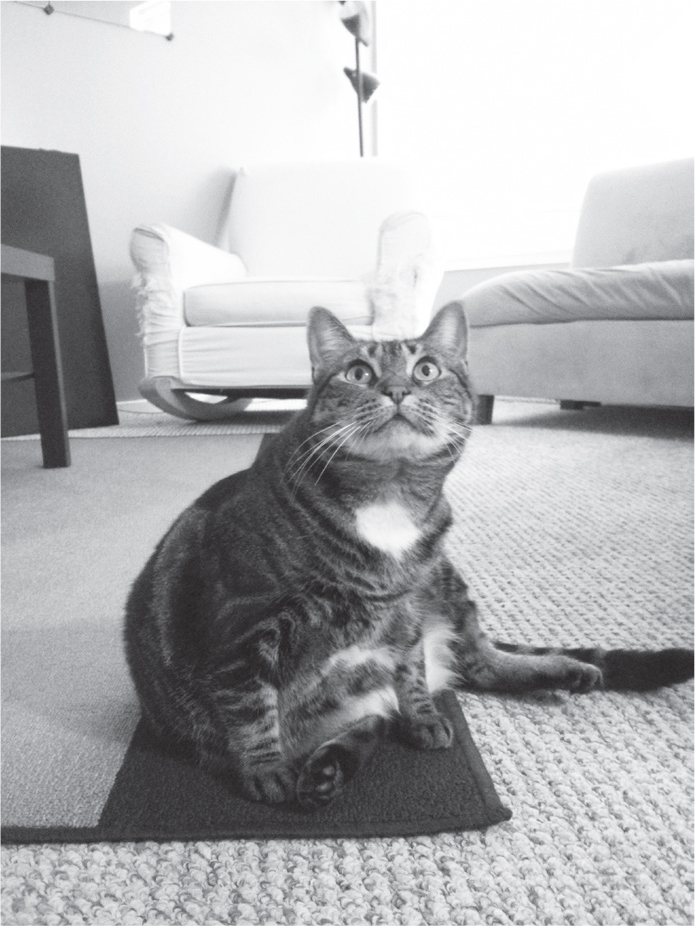
Figure 21-3: My cat, Zophie
If the image file isn’t in the current working directory, change the working directory to the folder that contains the image file by calling the os.chdir() function:
>>> import os
>>> os.chdir('C:\\folder_with_image_file')
The Image.open() function returns a value of the Image object data type, which Pillow uses to represent an image as a Python value. You can load an Image object from an image file of any format by passing the Image.open() function a string of the filename. You can save any changes you make to the Image object to an image file (also of any format) with the save() method. All the rotations, resizing, cropping, drawing, and other image manipulations will occur through method calls on this Image object.
To shorten the examples in this chapter, I’ll assume you’ve imported Pillow’s Image module and stored the Zophie image in a variable named cat_im. Be sure that the zophie.png file is in the current working directory so that the Image.open() function can find it. Otherwise, you’ll have to specify the full absolute path in the function’s string argument.
Working with the Image Data Type
An Image object has several useful attributes that give you basic information about the image file from which it was loaded: its width and height, the filename, and the graphics format (such as JPEG, WebP, GIF, or PNG). For example, enter the following into the interactive shell:
>>> from PIL import Image
>>> cat_im = Image.open('zophie.png')
>>> cat_im.size
❶ (816, 1088)
❷ >>> width, height = cat_im.size
❸ >>> width
816
❹ >>> height
1088
>>> cat_im.filename
'zophie.png'
>>> cat_im.format
'PNG'
>>> cat_im.format_description
'Portable network graphics'
❺ >>> cat_im.save('zophie.jpg')
After you’ve created an Image object from zophie.png and stored the Image object in cat_im, the object’s size attribute contains a tuple of the image’s width and height in pixels ❶. You can assign the values in the tuple to width and height variables ❷ in order to access the width ❸ and height ❹ individually. The filename attribute describes the original file’s name. The format and format_description attributes are strings that describe the image format of the original file (with format_description being a bit more verbose).
Finally, calling the save() method and passing it 'zophie.jpg' saves a new image with the filename zophie.jpg to your hard drive ❺. Pillow sees that the file extension is .jpg and automatically saves the image using the JPEG image format. Now you should have two images, zophie.png and zophie.jpg, on your hard drive. While these files are based on the same image, they are not identical, because of their different formats.
Pillow also provides the Image.new() function, which returns an Image object—much like Image.open(), except the image represented by Image.new()’s object will be blank. The arguments to Image.new() are as follows:
- The string 'RGBA', which sets the color mode to RGBA. (There are other modes that this book doesn’t go into.)
- The size as a two-integer tuple of the new image’s width and height.
- The background color that the image should start with, as a four-integer tuple of an RGBA value. You can use the return value of the ImageColor.getcolor() function for this argument. Alternatively, you can pass the standard color name as a string.
For example, enter the following into the interactive shell:
>>> from PIL import Image
❶ >>> im = Image.new('RGBA', (100, 200), 'purple')
>>> im.save('purpleImage.png')
❷ >>> im2 = Image.new('RGBA', (20, 20))
>>> im2.save('transparentImage.png')
Here, we create an Image object for an image that’s 100 pixels wide and 200 pixels tall, with a purple background ❶. We then save this image to the file purpleImage.png. We call Image.new() again to create another Image object, this time passing (20, 20) for the dimensions and nothing for the background color ❷. Invisible black, (0, 0, 0, 0), is the default color used if no color argument is specified, so the second image has a transparent background. We save this 20×20 transparent square in transparentImage.png.
Cropping Images
Cropping an image means selecting a rectangular region inside an image and removing everything outside the rectangle. The crop() method of Image objects takes a box tuple and returns an Image object representing the cropped image. The cropping doesn’t happen in place—that is, the original Image object is left untouched, and the crop() method returns a new one. Remember that a box tuple (in this case, the cropped section) includes the left column and top row of pixels but not the right column and bottom row of pixels.
Enter the following into the interactive shell:
>>> from PIL import Image
>>> cat_im = Image.open('zophie.png')
>>> cropped_im = cat_im.crop((335, 345, 565, 560))
>>> cropped_im.save('cropped.png')
This code makes a new Image object for the cropped image, stores the object in cropped_im, and then calls save() on cropped_im to save the cropped image in cropped.png, shown in Figure 21-4.
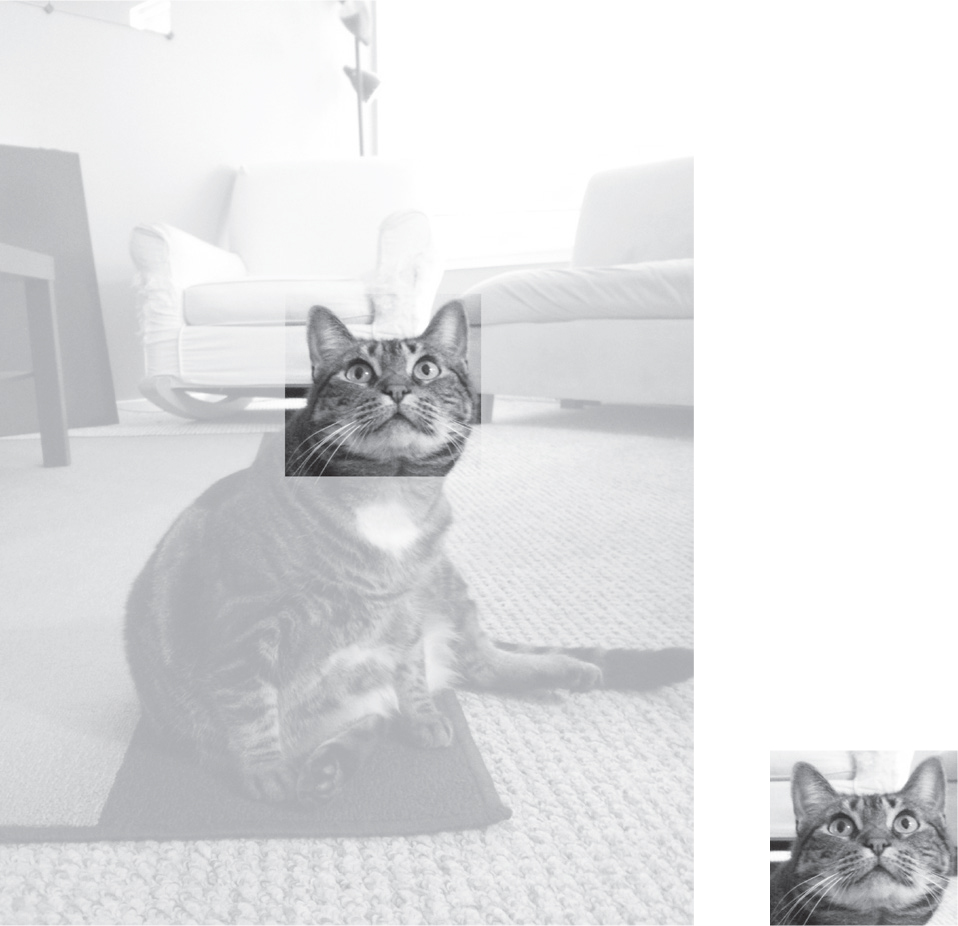
Figure 21-4: The new image is the cropped section of the original image.
Cropping creates the new file from the original.
Pasting Images onto Other Images
The copy() method will return a new Image object containing the same image as the Image object on which it was called. This is useful if you need to make changes to an image but also want to keep an untouched version of the original. For example, enter the following into the interactive shell:
>>> from PIL import Image
>>> cat_im = Image.open('zophie.png')
>>> cat_copy_im = cat_im.copy()
The cat_im and cat_copy_im variables contain two separate Image objects, which both have the same image on them. Now that you have an Image object stored in cat_copy_im, you can modify cat_copy_im as you like and save it to a new filename, leaving cat_im untouched.
When called on an Image object, the paste() method pastes another image on top of it. Let’s continue the shell example by pasting a smaller image onto cat_copy_im:
>>> face_im = cat_im.crop((335, 345, 565, 560))
>>> face_im.size
(230, 215)
>>> cat_copy_im.paste(face_im, (0, 0))
>>> cat_copy_im.paste(face_im, (400, 500))
>>> cat_copy_im.save('pasted.png')
First, we pass crop() a box tuple for the rectangular area in zophie.png that contains Zophie’s face. This method call creates an Image object representing a 230×215 crop, which we store in face_im. Now we can paste face_im onto cat_copy_im. The paste() method takes two arguments: a source Image object and a tuple of the x- and y-coordinates where we want to paste the top-left corner of the source Image object onto the main Image object. Here, we call paste() twice on cat_copy_im, pasting two copies of face_im onto cat_copy_im. Finally, we save the modified cat_copy_im to pasted.png, shown in Figure 21-5.
NOTE
Despite their names, the copy() and paste() methods in Pillow don’t use your computer’s clipboard.
The paste() method modifies its Image object in place; it doesn’t return an Image object with the pasted image. If you want to call paste() but also keep an untouched version of the original image around, you’ll need to first copy the image and then call paste() on that copy.
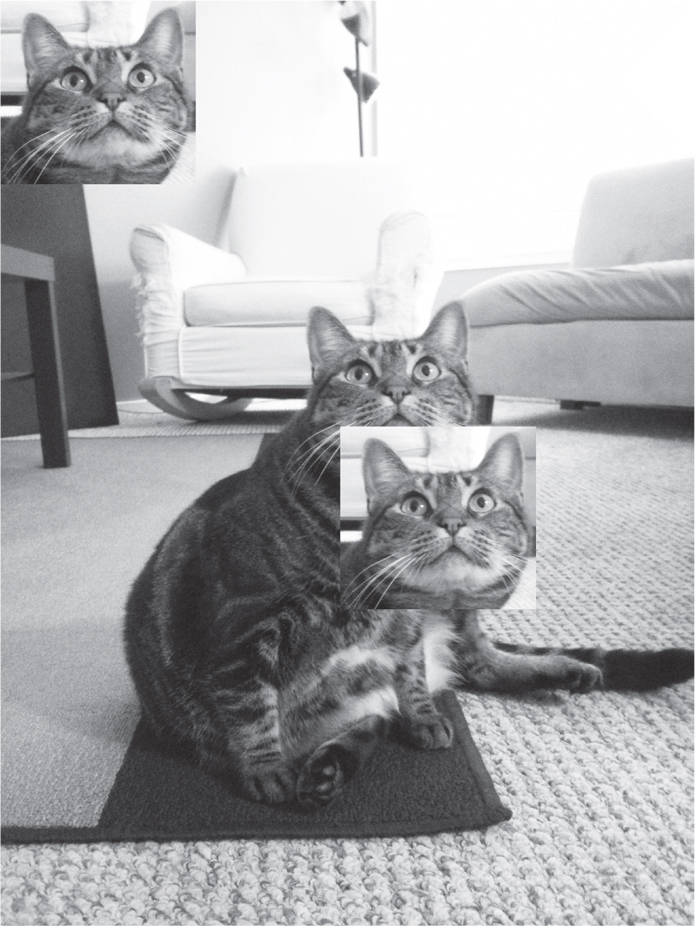
Figure 21-5: Zophie the cat, with her face pasted twice
Say you want to tile Zophie’s head across the entire image, as in Figure 21-6.
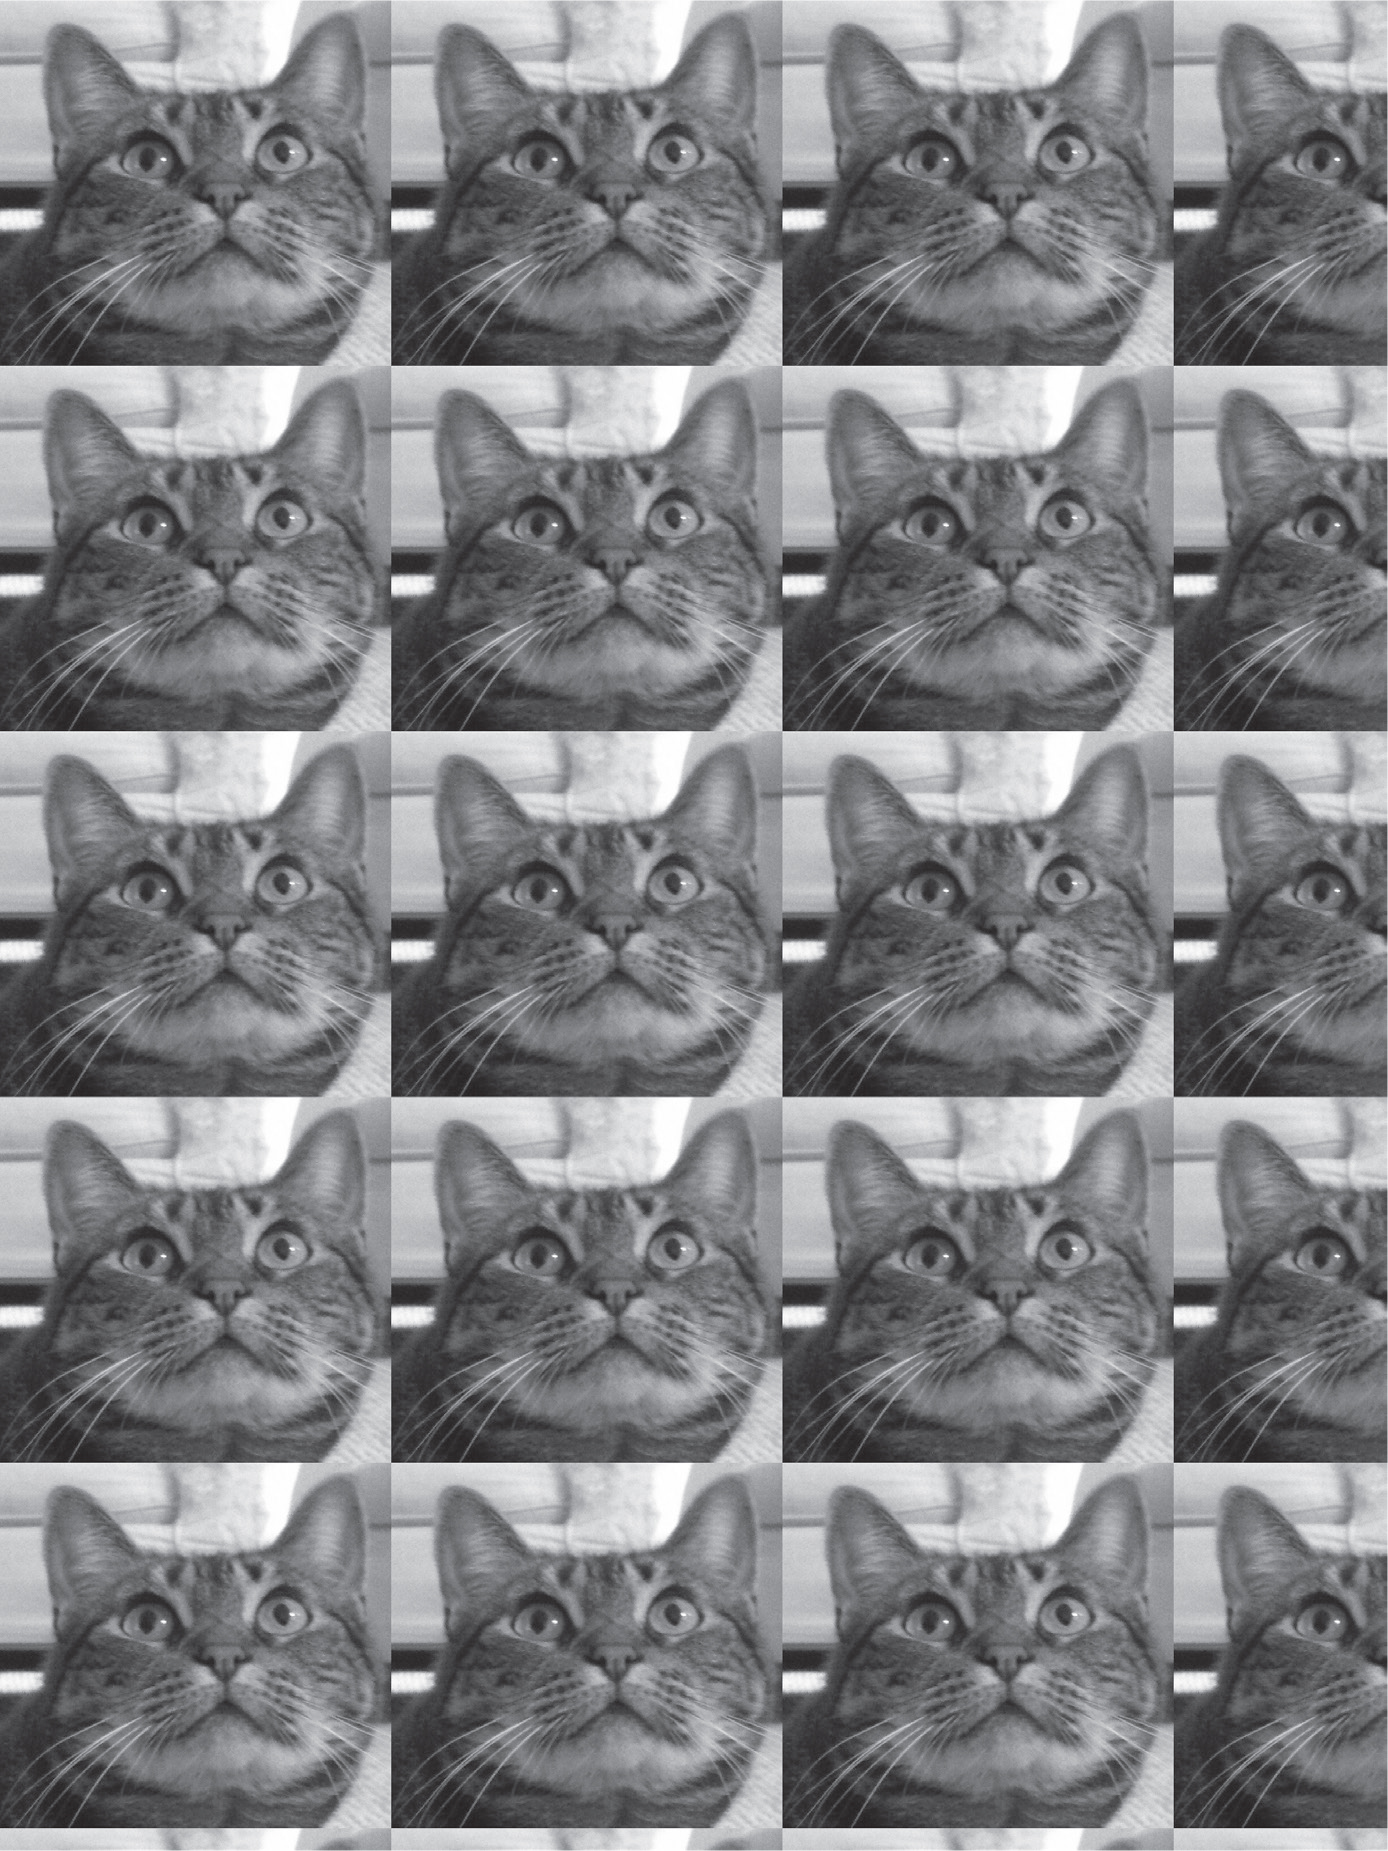
Figure 21-6: Nested for loops used with paste() can duplicate the cat’s face (creating a dupli-cat, if you will).
You can achieve this effect with a couple of for loops. Continue the interactive shell example by entering the following:
>>> cat_im_width, cat_im_height = cat_im.size
>>> face_im_width, face_im_height = face_im.size
❶ >>> cat_copy_im = cat_im.copy()
❷ >>> for left in range(0, cat_im_width, face_im_width):
...   ❸ for top in range(0, cat_im_height, face_im_height):
...         print(left, top)
...         cat_copy_im.paste(face_im, (left, top))
...
0 0
0 215
0 430
0 645
0 860
0 1075
230 0
230 215
--snip--
690 860
690 1075
>>> cat_copy_im.save('tiled.png')
We store the original image’s width and height in cat_im_width and cat_im_height. Next, we make a copy of the image and store it in cat_copy_im ❶. Now we can loop, pasting face_im onto the copy. The outer for loop’s left variable starts at 0 and increases by face_im_width ❷. The inner for loop’s top variable starts at 0 and increases by face_im_height ❸. These nested for loops produce values for left and top that paste a grid of face_im images over the Image object, as in Figure 21-6. To see the nested loops at work, we print left and top. After the pasting is complete, we save the modified cat_copy_im to tiled.png.
If you’re pasting an image with transparency, you’ll need to pass the image as the optional third argument, which tells Pillow what parts of the original image to paste. Otherwise, transparent pixels in the original image will appear as white pixels in the pasted-on image. We’ll explore this practice in more detail in “Project 16: Add a Logo” on page 507.
Resizing Images
When called on an Image object, the resize() method returns a new Image object of the specified width and height. It accepts a two-integer tuple argument representing the new dimensions. Enter the following into the interactive shell:
>>> from PIL import Image
>>> cat_im = Image.open('zophie.png')
❶ >>> width, height = cat_im.size
❷ >>> quarter_sized_im = cat_im.resize((int(width / 2), int(height / 2)))
>>> quarter_sized_im.save('quartersized.png')
❸ >>> svelte_im = cat_im.resize((width, height + 300))
>>> svelte_im.save('svelte.png')
We assign the two values in the cat_im.size tuple to the variables width and height ❶. Using these variables instead of cat_im.size[0] and cat_im.size[1] makes the rest of the code more readable.
The first resize() call passes int(width / 2) for the new width and int(height / 2) for the new height ❷, so the Image object returned from resize() will be half the width and height of the original image, or one-quarter of the original image size overall. The resize() method accepts only integers in its tuple argument, which is why you needed to wrap both divisions by 2 in an int() call.
This resizing keeps the same proportions as the original image, but the new width and height values don’t have to conserve those proportions. The svelte_im variable contains an Image object that has the original width but a height that is 300 pixels taller ❸, giving Zophie a more slender look.
Note that the resize() method doesn’t edit the Image object in place but instead returns a new Image object.
Rotating and Flipping Images
To rotate images, use the rotate() method, which returns a new Image object and leaves the original unchanged. The method accepts a single integer or float representing the number of degrees by which to rotate the image counterclockwise. Enter the following into the interactive shell:
>>> from PIL import Image
>>> cat_im = Image.open('zophie.png')
>>> cat_im.rotate(90).save('rotated90.png')
>>> cat_im.rotate(180).save('rotated180.png')
>>> cat_im.rotate(270).save('rotated270.png')
Note that you can chain method calls by calling save() directly on the Image object returned from rotate(). The first rotate() and save() chain rotates the image counterclockwise by 90 degrees and saves it to rotated90 .png. The second and third calls do the same, except they rotate the image by 180 degrees and 270 degrees, respectively. The results look like Figure 21-7.
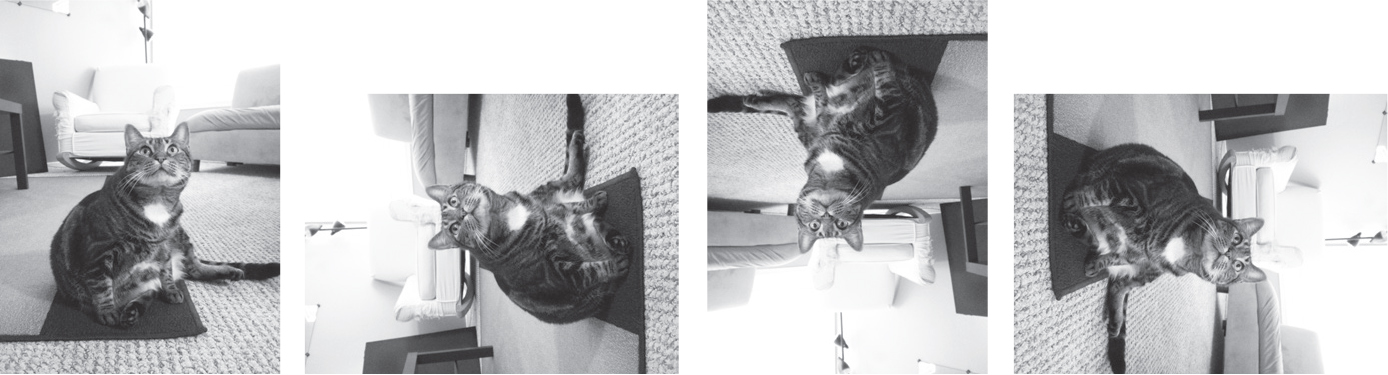
Figure 21-7: The original image (left) and the image rotated counterclockwise by 90, 180, and 270 degrees
The rotated images will have the same height and width as the original image. On Windows, a black background will fill in any gaps made by the rotation, as in Figure 21-8. On macOS and Linux, transparent pixels will fill in the gaps instead.
The rotate() method has an optional expand keyword argument that can be set to True to enlarge the dimensions of the image to fit the entire rotated new image. For example, enter the following into the interactive shell:
>>> cat_im.rotate(6).save('rotated6.png')
>>> cat_im.rotate(6, expand=True).save('rotated6_expanded.png')
The first call rotates the image by six degrees and saves it to rotated6.png. (See the image on the left of Figure 21-8.) The second call rotates the image by six degrees, sets expand to True, and saves the image to rotated6_expanded.png. (See the image on the right of Figure 21-8.)
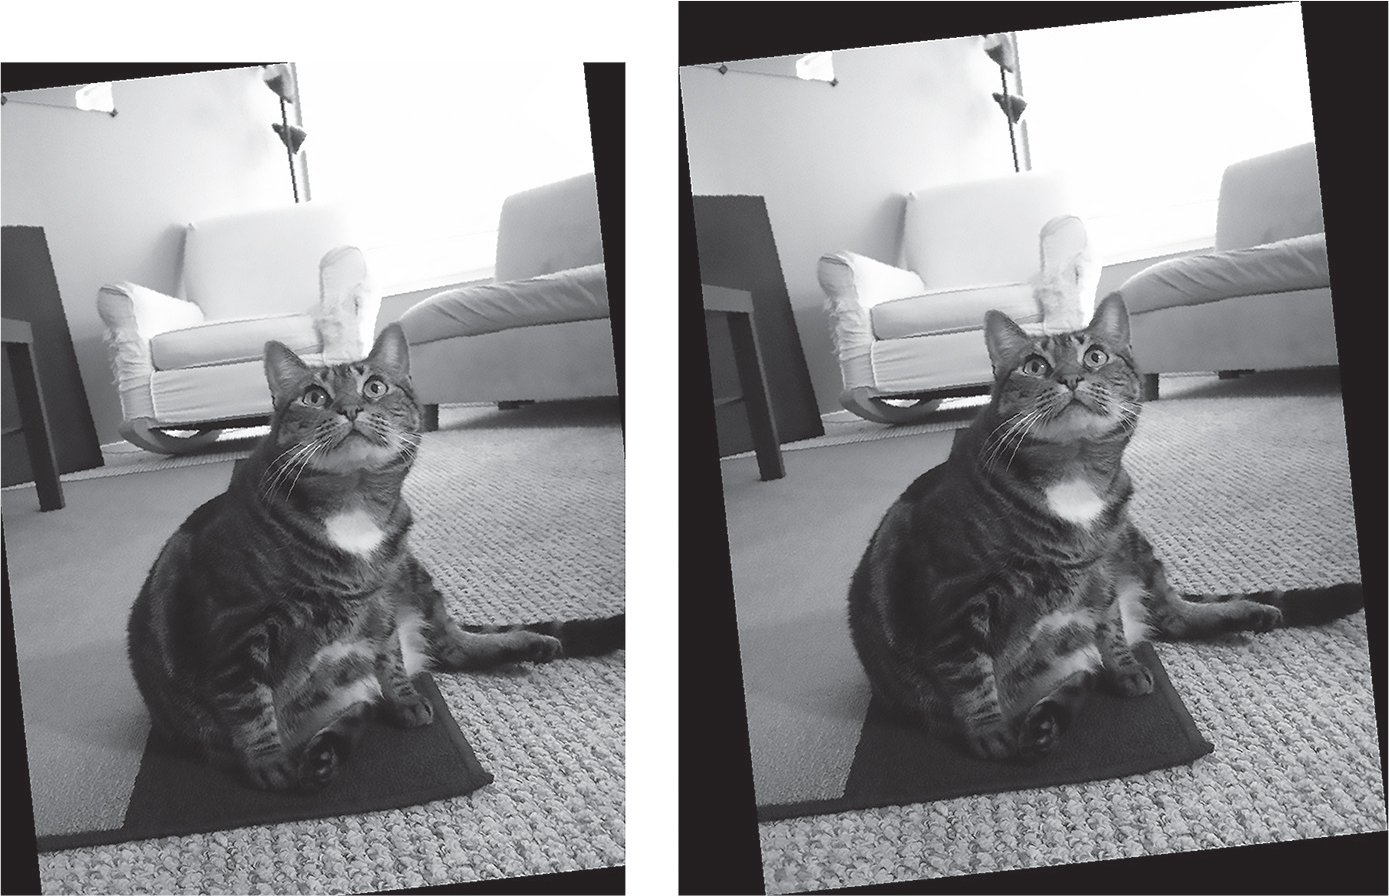
Figure 21-8: The image rotated by six degrees normally (left) and with expand=True (right)
If you rotate the image by 90, 180, or 270 degrees with expand=True, the rotated image won’t have a black or transparent background.
You can also mirror-flip an image, as in Figure 21-9, with the transpose() method.
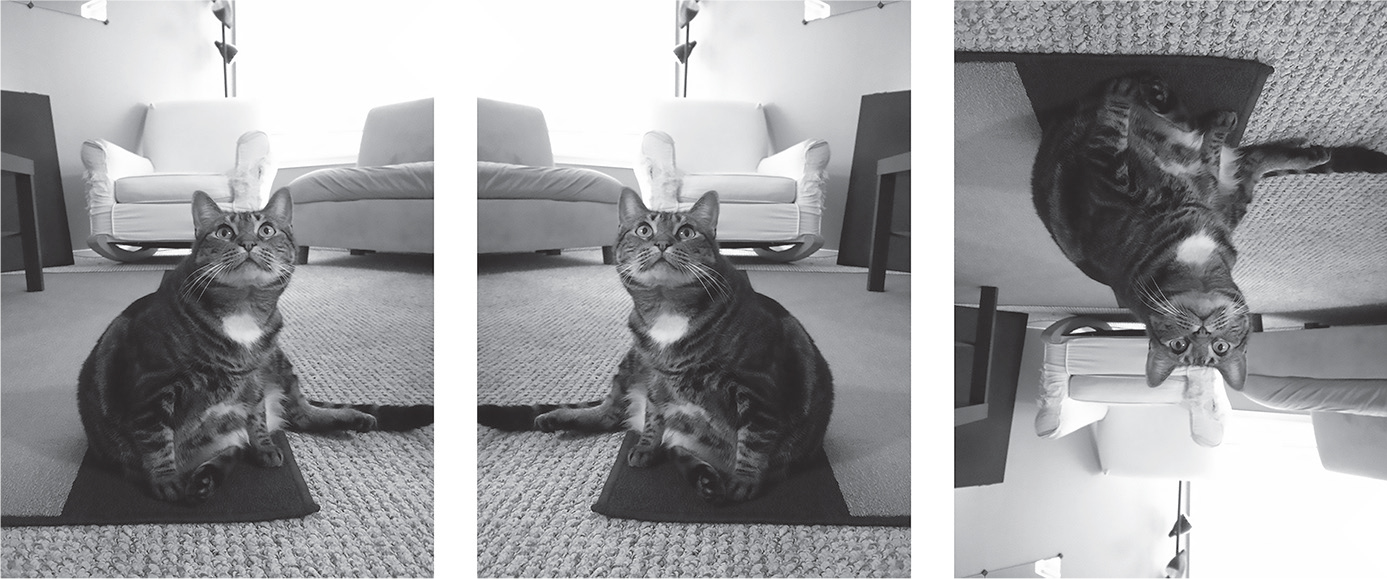
Figure 21-9: The original image (left), the image with a horizontal flip (center), and the image with a vertical flip (right)
Enter the following into the interactive shell:
>>> cat_im.transpose(Image.FLIP_LEFT_RIGHT).save('horizontal_flip.png')
>>> cat_im.transpose(Image.FLIP_TOP_BOTTOM).save('vertical_flip.png')
Like rotate(), transpose() creates a new Image object. We pass Image.FLIP_LEFT_RIGHT to flip the image horizontally and then save the result to horizontal_flip.png. To flip the image vertically, we pass Image.FLIP_TOP_BOTTOM and save the result to vertical_flip.png.
Changing Individual Pixels
The getpixel() method can retrieve the color of an individual pixel, and putpixel() can additionally alter that color. Both methods accept a tuple representing the pixel’s x- and y-coordinates. The putpixel() method takes an additional argument for the pixel’s new color, either as a four-integer RGBA tuple or as a three-integer RGB tuple. Enter the following into the interactive shell:
>>> from PIL import Image
❶ >>> im = Image.new('RGBA', (100, 100))
❷ >>> im.getpixel((0, 0))
(0, 0, 0, 0)
❸ >>> for x in range(100):
...     for y in range(50):
...       ❹ im.putpixel((x, y), (210, 210, 210))
...
>>> from PIL import ImageColor
❺ >>> for x in range(100):
...     for y in range(50, 100):
...       ❻ im.putpixel((x, y), ImageColor.getcolor('darkgray', 'RGBA'))
...
>>> im.getpixel((0, 0))
(210, 210, 210, 255)
>>> im.getpixel((0, 50))
(169, 169, 169, 255)
>>> im.save('putPixel.png')
We make a new image that is a 100×100 transparent square ❶. Calling getpixel() on coordinates in this image returns (0, 0, 0, 0) because the image is transparent ❷. To color its pixels, we use nested for loops to cycle through the pixels in the top half of the image ❸, passing putpixel() an RGB tuple representing a light gray ❹.
Say we want to color the bottom half of the image dark gray but don’t know the RGB tuple for dark gray. The putpixel() method doesn’t accept a standard color name like 'darkgray', so we use ImageColor.getcolor() to get a corresponding color tuple ❻. We loop through the pixels in the bottom half of the image ❺ and pass putpixel() the return value of this call, producing an image that is half light gray and half dark gray, as shown in Figure 21-10. We call getpixel() on any of the coordinates to confirm that the color of a given pixel is what we expect. Finally, we save the image to putPixel.png.
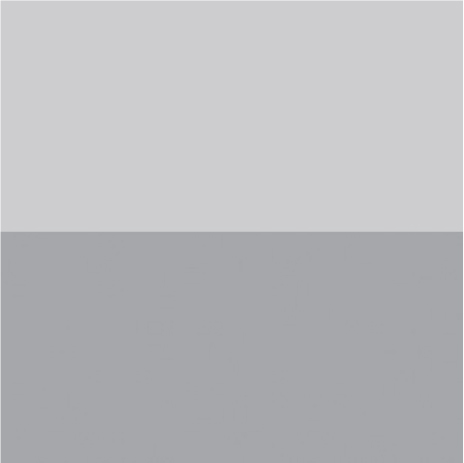
Figure 21-10: The putPixel.png image
Of course, drawing one pixel of an image at a time isn’t very convenient. If you need to draw shapes, use the ImageDraw functions explained in “Drawing on Images” on page 512.
Project 16: Add a Logo
Say you have the boring job of resizing thousands of images and adding a small logo watermark to the corner of each. Doing this with a basic graphics program such as Paintbrush or Paint would take forever. A fancier graphics application such as Photoshop can do batch processing, but that software costs hundreds of dollars. Let’s write a script to do it instead.
Imagine that Figure 21-11 is the logo you want to add to the bottom-right corner of each image: a black cat icon with a white border and transparent background. You can use your own logo image or download the one included in this book’s online resources.
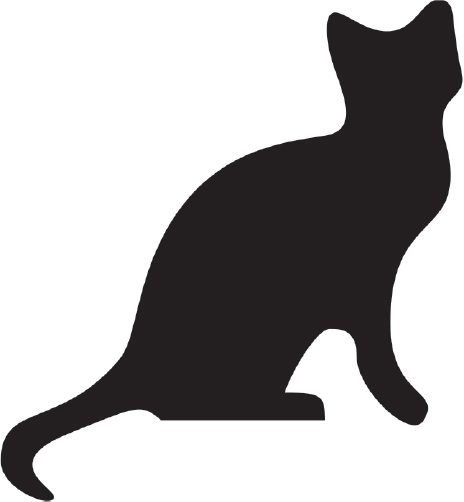
Figure 21-11: The logo to add to the image
At a high level, here’s what the program should do:
- Load the logo image.
- Loop over all .png and.jpg files in the working directory.
- Check whether the image is wider and taller than 300 pixels.
- If so, reduce the width or height (whichever is larger) to 300 pixels and scale down the other dimension proportionally.
- Paste the logo image into the corner.
- Save the altered images to another folder.
This means the code will need to do the following:
- Open the catlogo.png file as an Image object.
- Loop over the strings returned from os.listdir('.').
- Get the width and height of the image from the size attribute.
- Calculate the new width and height of the resized image.
- Call the resize() method to resize the image.
- Call the paste() method to paste the logo in the bottom-right corner.
- Call the save() method to save the changes, using the original filename.
Step 1: Open the Logo Image
Open a new file editor tab, enter the following code, and save it as resizeAndAddLogo.py:
# Resizes images to fit in a 300x300 square with a logo in the corner
import os
from PIL import Image

❶ SQUARE_FIT_SIZE = 300
❷ LOGO_FILENAME = 'catlogo.png'

❸ logo_im = Image.open(LOGO_FILENAME)
❹ logo_width, logo_height = logo_im.size

# TODO: Loop over all files in the working directory.

# TODO: Check if the image needs to be resized.

# TODO: Calculate the new width and height to resize to.

# TODO: Resize the image.

# TODO: Add the logo.

# TODO: Save changes.
By setting up the SQUARE_FIT_SIZE ❶ and LOGO_FILENAME ❷ constants at the start of the program, we’ve made it easy to change the program later. Say the logo that you’re adding isn’t the cat icon, or say you’re reducing the output images’ largest dimension to something other than 300 pixels. You can straightforwardly open the code and change those values once. You could also set the values of these constants by accepting command line arguments. Without these constants, you’d instead have to search the code for all instances of 300 and 'catlogo.png' and replace them with the new values.
The Image.open() method returns the logo Image object ❸. For readability, we assign the logo’s width and height to variables ❹. The rest of the program is a skeleton of TODO comments.
Step 2: Loop Over All Files
Now you need to find every .png file and .jpg file in the current working directory. You don’t want to add the logo image to the logo image itself, so the program should skip any image with a filename that is the same as LOGO_FILENAME. Add the following to your code:
# Resizes images to fit in a 300x300 square with a logo in the corner
import os
from PIL import Image

--snip--

os.makedirs('withLogo', exist_ok=True)
# Loop over all files in the working directory.
❶ for filename in os.listdir('.'):
  ❷ if not (filename.endswith('.png') or filename.endswith('.jpg')) \
       or filename == LOGO_FILENAME:
      ❸ continue  # Skip non-image files and the logo file itself.

  ❹ im = Image.open(filename)
    width, height = im.size

--snip--
First, the os.makedirs() call creates a withLogo folder in which to store the modified images, rather than overwriting the original image files. The exist_ok=True keyword argument will keep os.makedirs() from raising an exception if withLogo already exists. While the code loops through all the files in the working directory ❶, a long if statement checks for filenames that don’t end with .png or .jpg ❷. If it finds any—or if the file is the logo image itself—the loop should skip it and use continue to go to the next file ❸. If filename does end with '.png' or '.jpg' and isn’t the logo file, the code opens it as an Image object ❹ and saves its width and height.
Step 3: Resize the Images
The program should resize the image only if the width or height is larger than SQUARE_FIT_SIZE (300 pixels, in this case), so you should put the resizing code inside an if statement that checks the width and height variables. Add the following code to your program:
# Resizes images to fit in a 300x300 square with a logo in the corner
import os
from PIL import Image

--snip--

    # Check if the image needs to be resized.
    if width > SQUARE_FIT_SIZE and height > SQUARE_FIT_SIZE:
        # Calculate the new width and height to resize to.
        if width > height:
          ❶ height = int((SQUARE_FIT_SIZE / width) * height)
            width = SQUARE_FIT_SIZE
        else:
          ❷ width = int((SQUARE_FIT_SIZE / height) * width)
            height = SQUARE_FIT_SIZE

        # Resize the image.
        print(f'Resizing {filename}...')
      ❸ im = im.resize((width, height))

--snip--
If the image needs resizing, you must find out whether it’s a wide or tall image. If width is greater than height, the code should reduce the height by the same proportion as the width ❶. This proportion is the SQUARE_FIT_SIZE value divided by the current width, so the code sets the new height value to this proportion multiplied by the current height value. Because the division operator returns a float value, and resize() requires the dimensions to be integers, you must remember to convert the result to an integer with the int() function. Finally, the code will set the new width value to SQUARE_FIT_SIZE.
If the height is greater than or equal to the width, the else clause performs the same calculation, but swaps the height and width variables ❷. Once those variables contain the new image dimensions, the code passes them to the resize() method and stores the returned Image object ❸.
Step 4: Add the Logo and Save the Changes
Whether or not you resized the image, you should paste the logo to its bottom-right corner. Where exactly to insert the logo depends on the size of both the image and the logo. Figure 21-12 shows how to calculate the pasting position. The left coordinate at which to paste the logo is the image width minus the logo width, and the top coordinate at which to paste the logo is the image height minus the logo height.
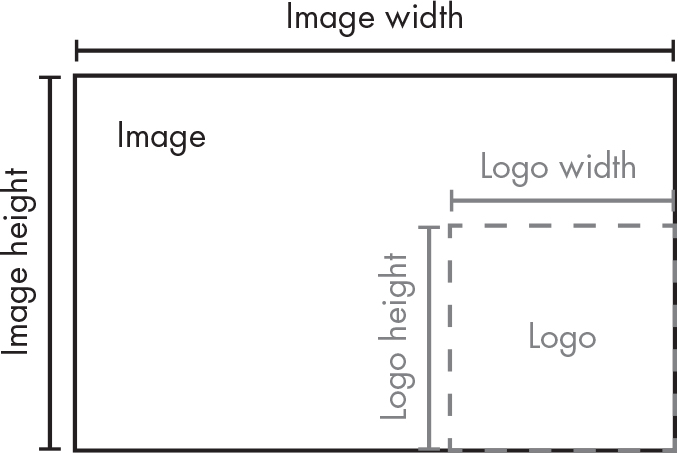
Figure 21-12: The left and top coordinates of the logo are the image width/height minus the logo width/height.
After your code pastes the logo into the image, it should save the modified Image object. Add the following to your program:
# Resizes images to fit in a 300x300 square with a logo in the corner
import os
from PIL import Image

--snip--

    # Check if the image needs to be resized.
    --snip--

    # Add the logo.
  ❶ print(f'Adding logo to {filename}...')
  ❷ im.paste(logo_im, (width – logo_width, height – logo_height), logo_im)

    # Save changes.
  ❸ im.save(os.path.join('withLogo', filename))
The new code prints a message telling the user that the logo is being added ❶, pastes logo_im onto im at the calculated coordinates ❷, and saves the changes to a filename in the withLogo directory ❸. When you run this program with the zophie.png and other image files in the working directory, the output will look like this:
Resizing zophie.png...
Adding logo to zophie.png...
Resizing zophie_xmas_tree.png...
Adding logo to zophie_xmas_tree.png...
Resizing me_and_zophie.png...
Adding logo to me_and_zophie.png...
The program converts zophie.png to a 225×300-pixel image that looks like Figure 21-13.
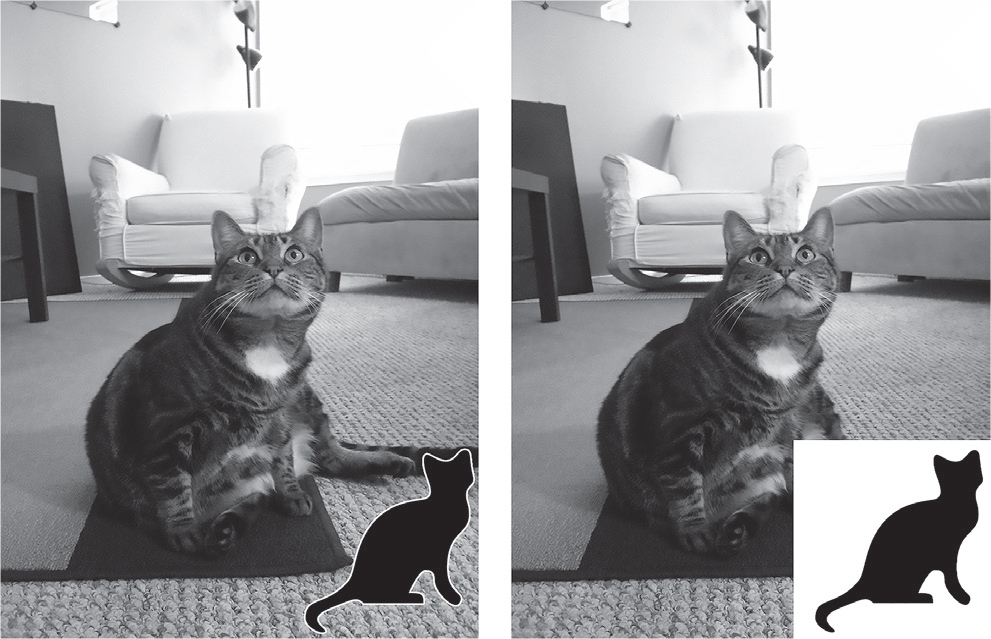
Figure 21-13: The program resized zophie.png and added the logo (left). If you forget the third argument, the transparent pixels in the logo will appear as solid white pixels (right).
Remember that the paste() method won’t paste the transparency pixels unless you pass logo_im as the third argument. This program can automatically resize and “logo-ify” hundreds of images in just a couple of minutes.
Ideas for Similar Programs
The ability to build composite images or modify image sizes in a batch is useful for many applications. You could write similar programs to do the following:
- Add text or a website URL to images.
- Add timestamps to images.
- Copy or move images into different folders based on their sizes.
- Add a mostly transparent watermark to an image to prevent others from copying it.
Drawing on Images
If you need to draw lines, rectangles, circles, or other simple shapes on an image, use Pillow’s ImageDraw module. For example, enter the following into the interactive shell:
>>> from PIL import Image, ImageDraw
>>> im = Image.new('RGBA', (200, 200), 'white')
>>> draw = ImageDraw.Draw(im)
First, we import Image and ImageDraw. Then, we create a 200×200 white image and store it in im. We pass this Image object to the ImageDraw.Draw() function to receive an ImageDraw object. This object has several methods for drawing shapes and text. Store the new object in a variable like draw so that you can easily use it in the following example.
Shapes
The following ImageDraw methods draw various kinds of shapes on the image. The fill and outline parameters for these methods are optional and will default to white if left unspecified.
Points
The point(xy, fill) method draws individual pixels. The xy argument represents a list of the points to draw. The list can contain x- and y-coordinate tuples, such as [(x, y), (x, y), ...], or x- and y-coordinates without tuples, such as [x1, y1, x2, y2, ...]. The fill argument colors the points and can be either an RGBA tuple or a string, such as 'red'. The fill argument is optional. The “point” name here refers to a pixel, not the unit of font size.
Lines
The line(xy, fill, width) method draws a line or series of lines. The xy argument is either a list of tuples, such as [(x, y), (x, y), ...], or a list of integers, such as [x1, y1, x2, y2, ...]. Each point is a connecting points on the lines you’re drawing. The optional fill argument specifies the color of the lines as an RGBA tuple or color name. The optional width argument determines the width of the lines, and defaults to 1 if left unspecified.
Rectangles
The rectangle(xy, fill, outline, width) method draws a rectangle. The xy argument is a box tuple of the form (left, top, right, bottom). The left and top values specify the x- and y-coordinates of the upper-left corner of the rectangle, while right and bottom specify the coordinates of the lower-right corner. The optional fill argument is the color of the inside of the rectangle. The optional outline argument is the color of the rectangle’s outline. The optional width argument represents the width of the lines, and defaults to 1 if left unspecified.
Ellipses
The ellipse(xy, fill, outline, width) method draws an ellipse. If the width and height of the ellipse are identical, this method will draw a circle. The xy argument is a box tuple (left, top, right, bottom) representing a box that precisely contains the ellipse. The optional fill argument is the color of the inside of the ellipse, and the optional outline argument is the color of the ellipse’s outline. The optional width argument is the width of the lines, and defaults to 1 if left unspecified.
Polygons
The polygon(xy, fill, outline, width) method draws an arbitrary polygon. The xy argument is a list of tuples, such as [(x, y), (x, y), ...], or integers, such as [x1, y1, x2, y2, ...], representing the connecting points of the polygon’s sides. The last pair of coordinates will automatically connect to the first pair. The optional fill argument is the color of the inside of the polygon, and the optional outline argument is the color of the polygon’s outline. The optional width argument is the width of the lines, and defaults to 1 if left unspecified.
A Drawing Example
To practice using these methods, enter the following into the interactive shell:
>>> from PIL import Image, ImageDraw
>>> im = Image.new('RGBA', (200, 200), 'white')
>>> draw = ImageDraw.Draw(im)
>>> draw.line([(0, 0), (199, 0), (199, 199), (0, 199), (0, 0)], fill='black') ❶
>>> draw.rectangle((20, 30, 60, 60), fill='blue') ❷
>>> draw.ellipse((120, 30, 160, 60), fill='red') ❸
>>> draw.polygon(((57, 87), (79, 62), (94, 85), (120, 90), (103, 113)), fill='brown') ❹
>>> for i in range(100, 200, 10): ❺
...        draw.line([(i, 0), (200, i - 100)], fill='green')

>>> im.save('drawing.png')
After making an Image object for a 200×200 white image, passing it to ImageDraw.Draw() to get an ImageDraw object, and storing the ImageDraw object in draw, we can call drawing methods on draw. Here, we make a thin, black outline at the edges of the image ❶, a blue rectangle whose top-left corner is at (20, 30) and whose bottom-right corner is at (60, 60) ❷, a red ellipse defined by a box from (120, 30) to (160, 60) ❸, a brown polygon with five points ❹, and a pattern of green lines drawn with a for loop ❺. The resulting drawing.png file will look like Figure 21-14 (though the colors aren’t printed in this book).
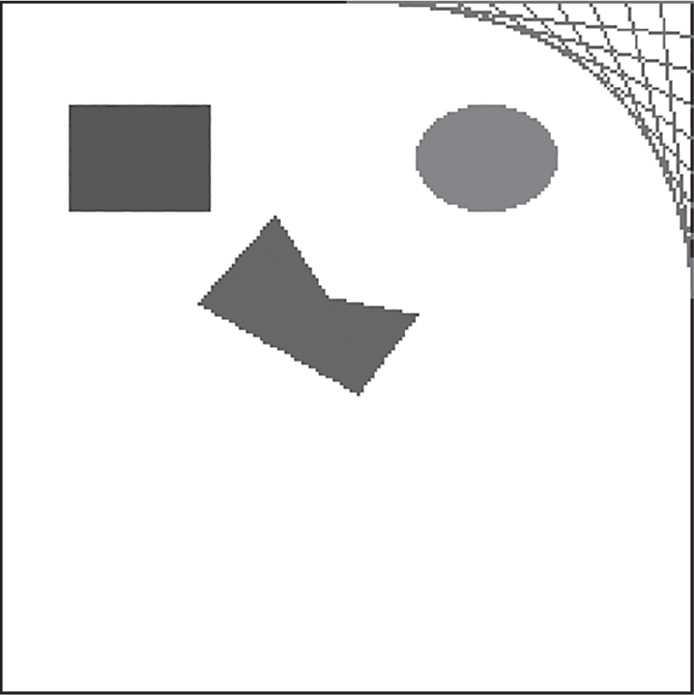
Figure 21-14: The resulting drawing.png image
You can use several other shape-drawing methods on ImageDraw objects. The full documentation is available at https://
Text
The ImageDraw object also has a text() method for drawing text onto an image. This method takes four arguments:
xy A two-integer tuple specifying the upper-left corner of the text box
text The string of text you want to write
fill The color of the text
font An optional ImageFont object used to set the typeface and size of the text
Before we use text() to draw text onto an image, let’s discuss the optional font argument in more detail. This argument is an ImageFont object, which you can get by running the following:
>>> from PIL import ImageFontOnce you’ve imported Pillow’s ImageFont module, access the font by calling the ImageFont.truetype() function, which takes two arguments. The first is a string representing the font’s TrueType file, the actual font file that lives on your hard drive. A TrueType file has the .ttf file extension and usually lives in C:\Windows\Fonts on Windows, /Library/Fonts and /System/Library/Fonts on macOS, and /usr/share/fonts/truetype on Linux. You don’t need to enter these paths as part of the TrueType file string, because Pillow knows to automatically search these directories, but it will display an error if it’s unable to find the font you specified.
The second argument to ImageFont.truetype() is an integer for the font size in points (rather than pixels). Pillow creates PNG images that are 72 pixels per inch by default, and a point is 1/72 of an inch. For practice, enter the following into the interactive shell:
>>> from PIL import Image, ImageDraw, ImageFont
>>> import os
❶ >>> im = Image.new('RGBA', (200, 200), 'white')
❷ >>> draw = ImageDraw.Draw(im)
❸ >>> draw.text((20, 150), 'Hello', fill='purple')
❹ >>> arial_font = ImageFont.truetype('arial.ttf', 32)
❺ >>> draw.text((100, 150), 'Howdy', fill='gray', font=arial_font)
>>> im.save('text.png')
After importing Image, ImageDraw, ImageFont, and os, we make an Image object for a new 200×200 white image ❶ and create an ImageDraw object from the Image object ❷. We use text() to write Hello at (20, 150) in purple ❸. We didn’t pass the optional fourth argument in this call, so the text’s typeface and size aren’t customized.
Next, to set a typeface and size, we call ImageFont.truetype(), passing it the .ttf file for the desired font, followed by an integer font size ❹. We store the returned Font object in a variable, then pass the variable to the text() method’s final keyword argument. The method call draws Howdy at (100, 150) in gray in 32-point Arial ❺. The resulting text.png file looks like Figure 21-15.
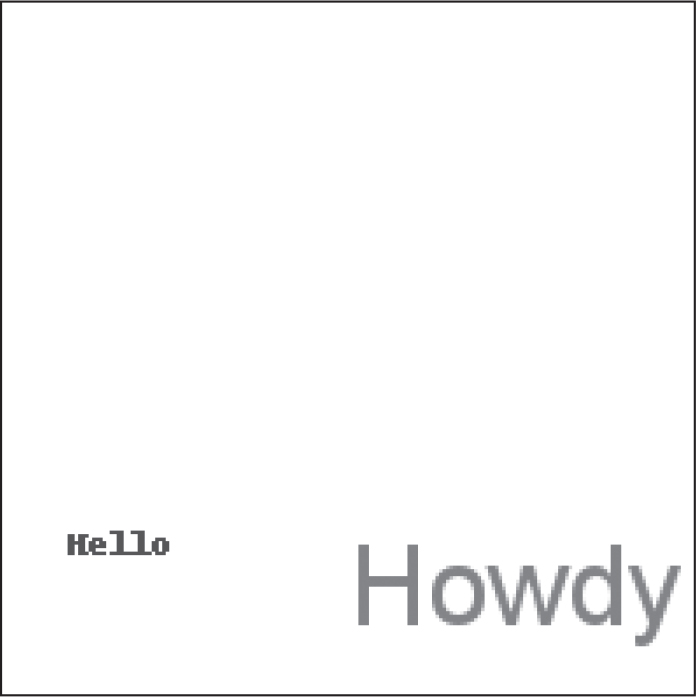
Figure 21-15: The resulting text.png image
If you’re interested in creating computer-generated art with Python, check out Learn Python Visually by Tristan Bunn (No Starch Press, 2021) or my book The Recursive Book of Recursion (No Starch Press, 2022).
Copying and Pasting Images to the Clipboard
Just as the third-party pyperclip module allows you to copy and paste text strings to the clipboard, the pyperclipimg module can copy and paste Pillow Image objects. To install pyperclipimg, see the instructions in Appendix A.
The pyperclipimg.copy() function takes a Pillow Image object and puts it on your operating system’s clipboard. You can then paste it into a graphics or image processing program such as MS Paint. The pyperclipimg.paste() function returns the image contents of the clipboard as an Image object. With zophie.png in the current working directory, enter the following into the interactive shell:
>>> from PIL import Image
>>> im = Image.open('zophie.png')
>>> import pyperclipimg
>>> pyperclipimg.copy(im)
>>> pasted_im = pyperclipimg.paste() # Now copy a new image to the clipboard.
>>> # Paste the clipboard contents to a graphics program.
>>> pasted_im.show()  # Shows the image from the clipboard
In this code, we first open the zophie.png image as an Image object, then pass it to pyperclipimg.copy() to copy it to the clipboard. You can verify that the copy worked by pasting the image into a graphics program. Next, copy a new image from a graphics program or by right-clicking an image in your web browser and copying it. Calling pyperclipimg.paste() returns this image as an Image object in the pasted_im variable. You can verify that the paste worked by viewing it with pasted_im.show().
The pyperclipimg module can be useful as a way to let users input and output image data to your Python programs.
Creating Graphs with Matplotlib
Drawing your own graphs using Pillow is possible but would require a lot of work. The Matplotlib library creates a wide variety of graphs for use in professional publications. In this chapter, we’ll create basic line graphs, bar graphs, scatter plots, and pie charts, but Matplotlib is able to create more complex 3D graphs as well. You can find the full documentation at https://
Line Graphs and Scatter Plots
Let’s start by creating a 2D line graph with two axes, x and y. A line graph is ideal for showing changes in one measure over time. In Matplotlib, the terms plot, graph, and chart are often used interchangeably, and the term figure refers to the window that contains one or more plots. Enter the following into the interactive shell:
>>> import matplotlib.pyplot as plt ❶
>>> x_values = [0, 1, 2, 3, 4, 5]
>>> y_values1 = [10, 13, 15, 18, 16, 20]
>>> y_values2 = [9, 11, 18, 16, 17, 19]
>>> plt.plot(x_values, y_values1) ❷
[<matplotlib.lines.Line2D object at 0x000002501D9A7D10>]
>>> plt.plot(x_values, y_values2)
[<matplotlib.lines.Line2D object at 0x00000250212AC6D0>]
>>> plt.savefig('linegraph.png')  # Saves the plot as an image file
>>> plt.show()  # Opens a window with the plot
>>> plt.show()  # Does nothing
We import matplotlib.pyplot under the name plt ❶ to make it easier to enter its functions. Next, to plot data points to a 2D figure, we must call the plt.plot() function. We first save a list of integers or floats in x_values for the x-axis, and then save a list of integers or floats in y_values1 for the y-axis ❷. The first values in the x-axis and y-axis lists are associated with each other, the second values in the two lists are associated with each other, and so on. After calling plt.plot() with these values, we call it a second time with x_values and y_values2 to add a second line to the graph.
Matplotlib will automatically select colors for the lines and an appropriate size for the graph. We can save the default graph as a PNG image by calling plt.savefig('linegraph.png').
Matplotlib has a preview feature that shows you the graph in a window, much like Pillow has the show() method for previewing Image objects. Call plt.show() to open the graph in a window. It will look like Figure 21-16.
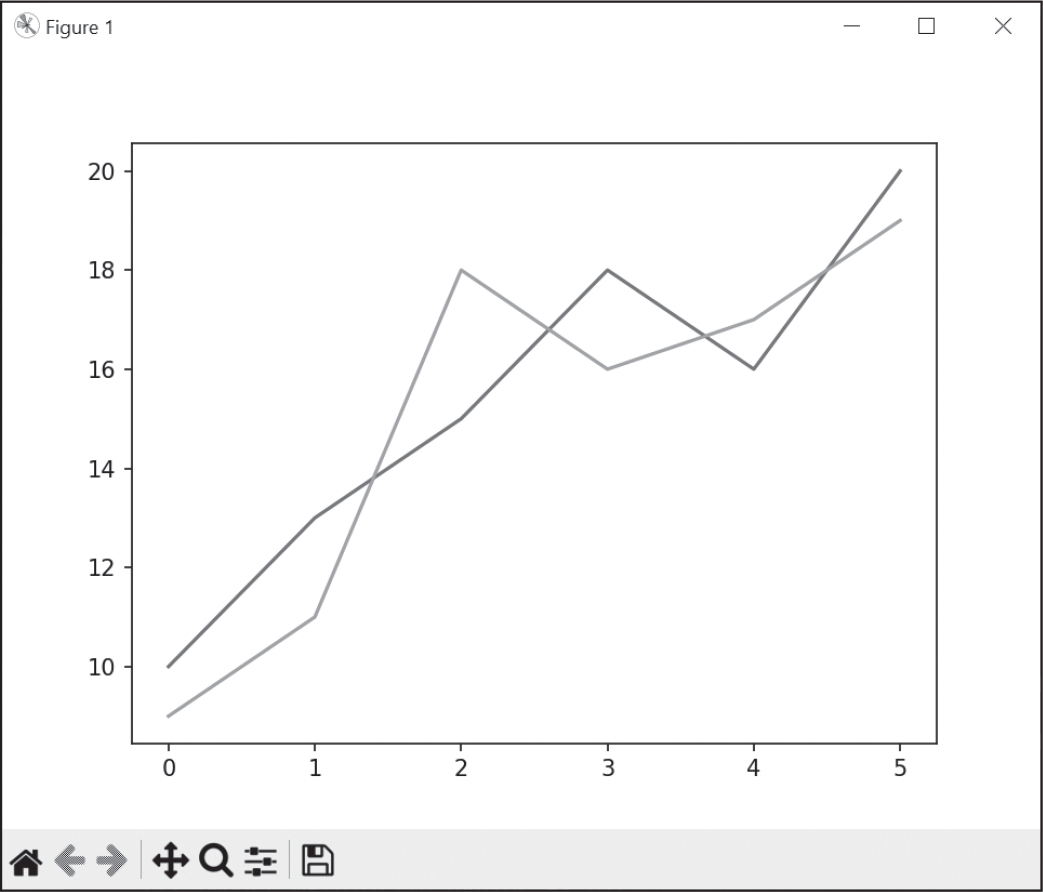
Figure 21-16: A line graph displayed with plt.show()
The window that plt.show() creates is interactive: you can move the graph around or zoom in or out. The house icon in the lower-left corner resets the view, and the floppy disk icon allows you to save the graph as an image file. If you’re experimenting with data, plt.show() is a convenient visualization tool. The plt.show() function call will block and not return until the user closes this window.
When you close the window that the plt.show() method creates, you also reset the graph data. Calling plt.show() a second time either does nothing or displays an empty window. You’ll have to call plt.plot() and any other plot-related functions again to re-create the graph. To save an image file of the graph, you must call plt.savefig() before calling plt.show().
To create a scatter plot of this same data, pass the x-axis and y-axis values to the plt.scatter() function:
>>> import matplotlib.pyplot as plt
>>> x_values = [0, 1, 2, 3, 4, 5]
>>> y_values1 = [10, 13, 15, 18, 16, 20]
>>> y_values2 = [9, 11, 18, 16, 17, 19]
>>> plt.scatter(x_values, y_values1)
<matplotlib.collections.PathCollection object at 0x00000250212CBAD0>
>>> plt.scatter(x_values, y_values2)
<matplotlib.collections.PathCollection object at 0x000002502132DC10>
>>> plt.savefig('scatterplot.png')
>>> plt.show()
When you call plt.show(), Matplotlib displays the plot in Figure 21-17. The code to create a scatter plot is identical to the code that creates a line graph, except for the function call.
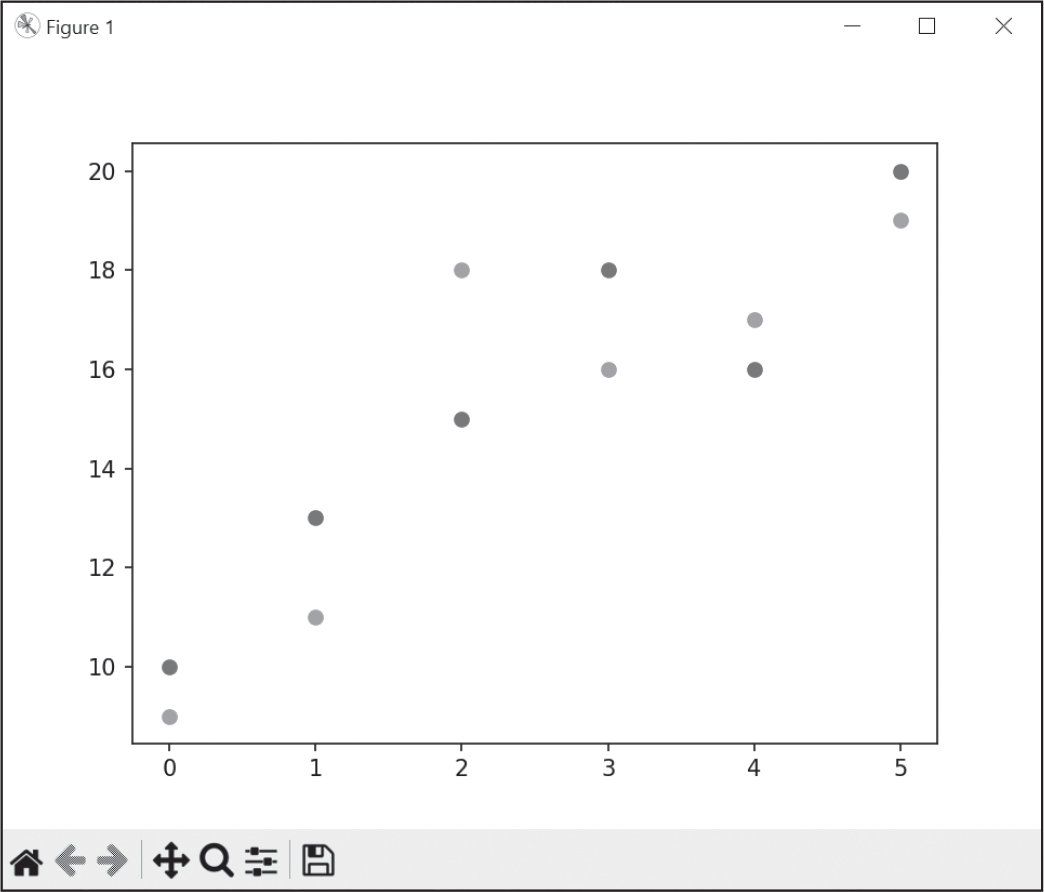
Figure 21-17: A scatter plot displayed with plt.show()
If you compare this graph to the line graph in Figure 21-16, you’ll see the data is the same, though the scatter plot uses points instead of connected lines.
Bar Graphs and Pie Charts
Let’s create a basic bar graph using Matplotlib. Bar graphs are useful for comparing the same type of data in different categories. Unlike a line graph, the order of the categories isn’t important, though they’re often listed alphabetically. Enter the following into the interactive shell:
>>> import matplotlib.pyplot as plt
>>> categories = ['Cats', 'Dogs', 'Mice', 'Moose']
>>> values = [100, 200, 300, 400]
>>> plt.bar(categories, values)
<BarContainer object of 4 artists>
>>> plt.savefig('bargraph.png')
>>> plt.show()
This code creates the bar graph shown in Figure 21-18. We pass the categories to list on the x-axis as the first list argument to plt.bar() and the values for each category as the second list argument.
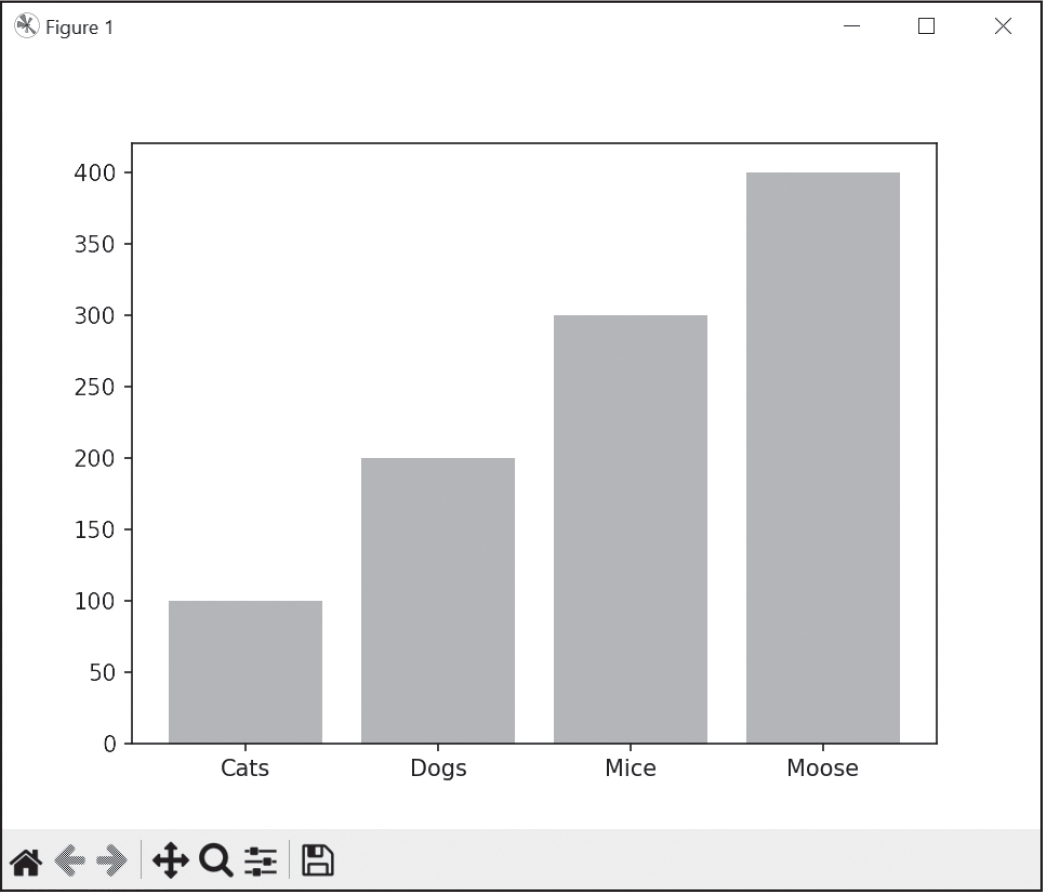
Figure 21-18: A bar graph displayed with plt.show()
Remember that closing the plt.show() window resets the graph data.
To create a pie chart, call the plt.pie() function. Instead of categories and values, a pie chart has labels and slices. Enter the following into the interactive shell:
>>> import matplotlib.pyplot as plt
>>> slices = [100, 200, 300, 400]  # The size of each slice
>>> labels = ['Cats', 'Dogs', 'Mice', 'Moose']  # The name of each slice
>>> plt.pie(slices, labels=labels, autopct='%.1f%%')
([<matplotlib.patches.Wedge object at 0x00000218F32BA950>,
--snip--
>>> plt.savefig('piechart.png')
>>> plt.show()
When you call plt.show() for the pie chart, Matplotlib displays it in a window, like in Figure 21-19. The plt.pie() function accepts a list of slice sizes and a list of labels for each slice.
The autopct argument specifies the precision of the percentage label for each slice. The argument is a format specifier string; the '%.1f%%' string specifies that the number should show one digit after the decimal point. If you leave this keyword argument out of the function call, the pie chart won’t list the percentage text.
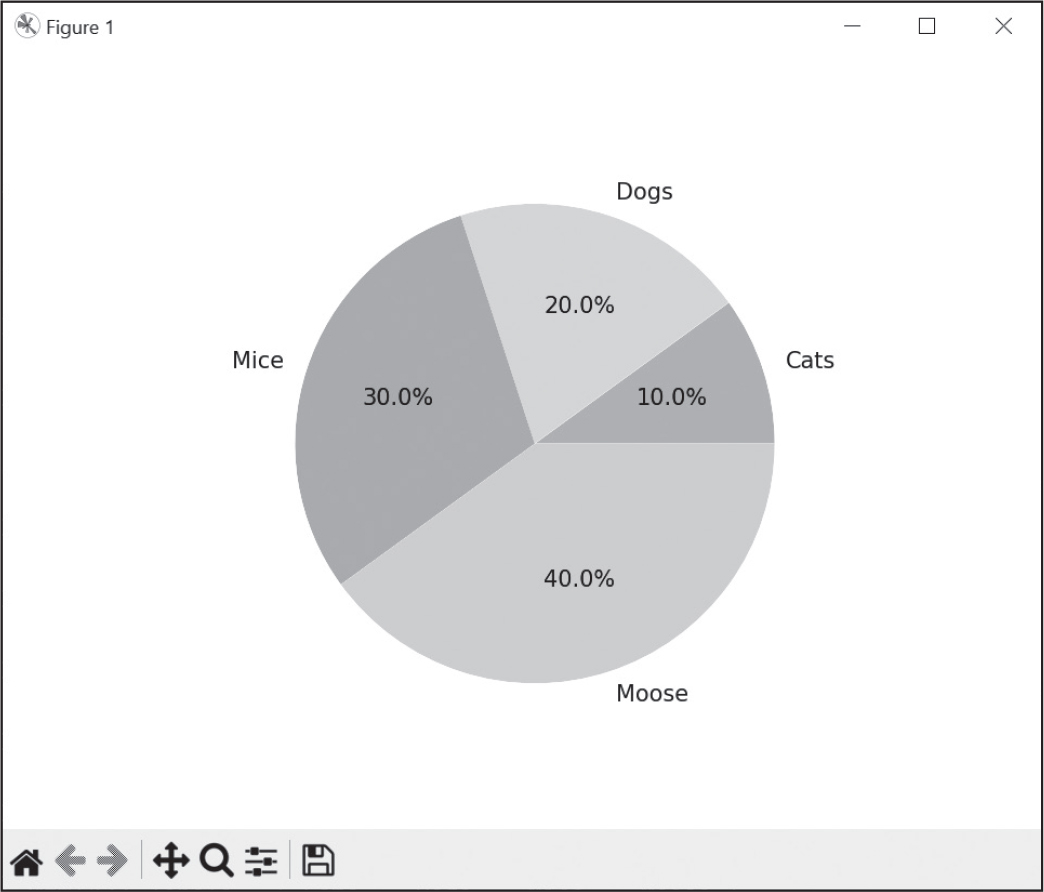
Figure 21-19: A pie chart displayed with plt.show()
Matplotlib automatically picks the colors for each slice, but you can customize this behavior, along with many other aspects of the graphs you create.
Additional Components
The graphs we created in the previous section are fairly basic. Matplotlib has a vast number of additional features that could fill a book of its own, so we’ll look at the most common components only. Let’s add data point markers, custom colors, and labels to our graphs. Enter the following into the interactive shell:
>>> import matplotlib.pyplot as plt
>>> x_values = [0, 1, 2, 3, 4, 5]
>>> y_values1 = [10, 13, 15, 18, 16, 20]
>>> y_values2 = [9, 11, 18, 16, 17, 19]
❶ >>> plt.plot(x_values, y_values1, marker='o', color='b', label='Line 1')
[<matplotlib.lines.Line2D object at 0x000001BC339D2F90>]
>>> plt.plot(x_values, y_values2, marker='s', color='r', label='Line 2')
[<matplotlib.lines.Line2D object at 0x000001BC339D1A90>]
❷ >>> plt.legend()
<matplotlib.legend.Legend object at 0x000001BC20915B90>
❸ >>> plt.xlabel('X-axis Label')
Text(0.5, 0, 'X-axis Label')
>>> plt.ylabel('Y-axis Label')
Text(0, 0.5, 'Y-axis Label')
>>> plt.title('Graph Title')
Text(0.5, 1.0, 'Graph Title')
❹ >>> plt.grid(True)
>>> plt.show()
After running this code, Matplotlib displays a window that looks like Figure 21-20. It contains the same line graph created previously, but we’ve added marker, color, and label keyword arguments to the plt.plot() function calls ❶. The marker creates a dot for each data point in the line. An 'o' value makes the dot an O-shaped circle, while 's' makes it a square. The 'b' and 'r' color arguments set the line to blue and red, respectively. We give each line a label to use in the legend created by calling plt.legend() ❷.
We also create labels for the x-axis, the y-axis, and the entire graph itself by calling plt.xlabel(), plt.ylabel(), and plt.title() ❸, passing the label text as strings. Finally, passing True to plt.grid() ❹ enables a grid with lines along the x-axis and y-axis values.
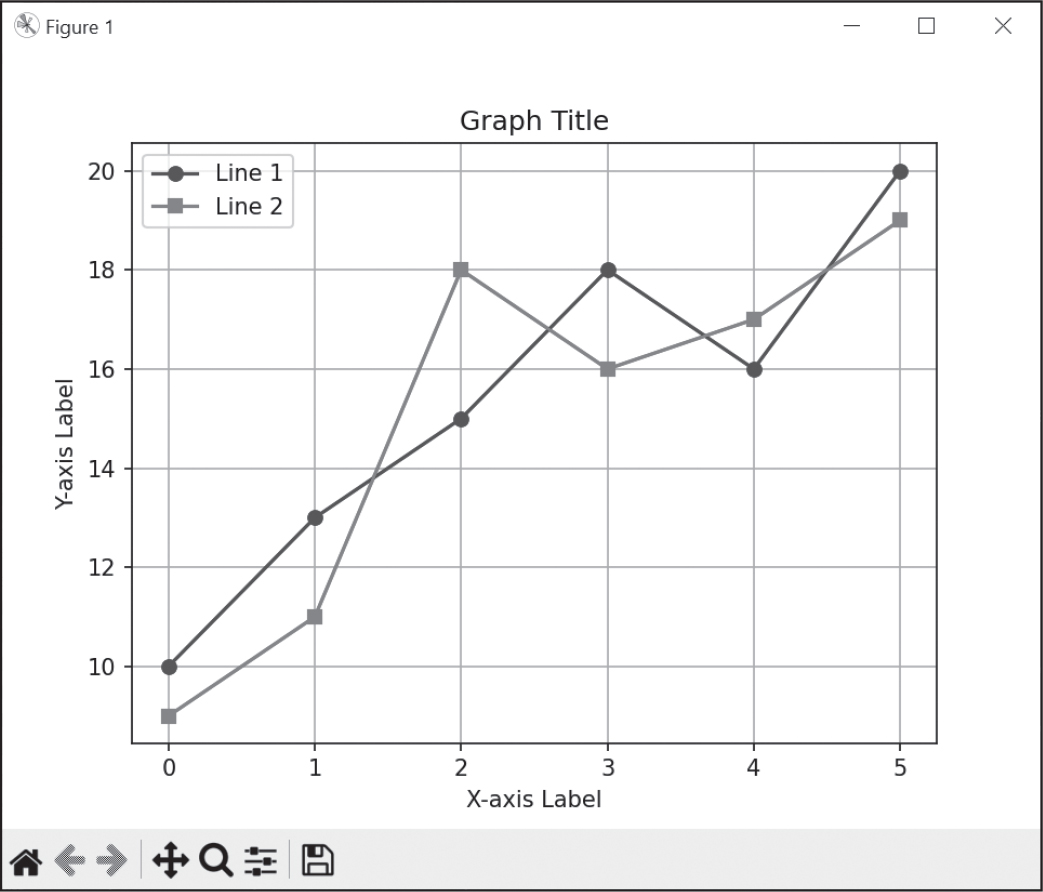
Figure 21-20: The example line graph with additional components
This is just a small sample of the features that Matplotlib provides. You can read about the other features in the online documentation.
Summary
Images consist of a collection of pixels, which each have an RGBA value for its color and a set of x- and y-coordinates representing its location. Two common image formats are JPEG and PNG. Pillow can handle both of these image formats, and others.
When a program loads an image into an Image object, its width and height dimensions are stored as a two-integer tuple in the size attribute. Objects of the Image data type also have methods for common image manipulations: crop(), copy(), paste(), resize(), rotate(), and transpose(). To save the Image object to an image file, call the save() method.
If you want your program to draw shapes onto an image, use ImageDraw methods to draw points, lines, rectangles, ellipses, and polygons. The module also provides methods for drawing text in a typeface and font size of your choosing.
While the Pillow library lets you draw shapes and individual pixels, it’s easier to generate graphs using the Matplotlib library. You can create line, bar, and pie charts using Matplotlib’s default settings, or you can make specific customizations. The show() method displays the chart on your screen for previewing, and the save() method generates image files you could include in documents or spreadsheets. The library’s online documentation can tell you more about its rich features.
Although advanced (and expensive) applications such as Photoshop provide automatic batch processing features, you can use Python scripts to do many of the same modifications for free. In the previous chapters, you wrote Python programs to deal with plaintext files, spreadsheets, PDFs, and other formats. With Pillow, you’ve extended your programming powers to processing images as well!
Practice Questions
1. What is an RGBA value?
2. How can you get the RGBA value of 'CornflowerBlue' from the Pillow module?
3. What is a box tuple?
4. What function returns an Image object for, say, an image file named zophie.png?
5. How can you find out the width and height of an Image object’s image?
6. What method would you call to get the Image object for the lower-left quarter of a 100×100 image?
7. After making changes to an Image object, how could you save it as an image file?
8. What module contains Pillow’s shape-drawing code?
9. Image objects do not have drawing methods. What kind of object does? How do you get this kind of object?
10. Which Matplotlib functions create a line graph, scatter plot, bar graph, and pie chart?
11. How can you save a Matplotlib graph as an image?
12. What does the plt.show() function do, and why can’t you call it twice in a row?
Practice Programs
For practice, write programs to do the following tasks.
Tile Maker
Write a program that produces a tiled image from a single image, much like tiles of cat faces in Figure 21-6. Your program should have a make_tile() function with three arguments: a string of the image filename, an integer for how many times it should be tiled horizontally, and an integer for how many times it should be tiled vertically. The make_tile() function should return a larger Image object of the tiled image. You will use the paste() methods as part of this function.
For example, if zophie_the_cat.jpg was a 20×50-pixel image, calling make_tile('zophie_the_cat.jpg', 6, 10) should return a 120×500 image with 60 tiles total. For a bonus, try randomly flipping or rotating the image to tile when pasting it to the larger image. This tile maker works best with smaller images to tile. See what abstract art you can create with this code.
Identifying Photo Folders on the Hard Drive
I have a bad habit of transferring files from my digital camera to temporary folders somewhere on the hard drive and then forgetting about these folders. It would be nice to write a program that could scan the entire hard drive and find these leftover photo folders.
Write a program that goes through every folder on your hard drive and finds potential photo folders. Of course, first you’ll have to define what you consider a “photo folder” to be; let’s say that it’s any folder where more than half of the files are photos. And how do you define what files are photos? First, a photo file must have the file extension .png or .jpg. Also, photos are large images; a photo file’s width and height must both be larger than 500 pixels. This is a safe bet, since most digital camera photos are several thousand pixels in width and height.
As a hint, here’s a rough skeleton of what this program might look like:
# Import modules and write comments to describe this program.

for folder_name, subfolders, filenames in os.walk('C:\\'):
    num_photo_files = 0
    num_non_photo_files = 0
    for filename in filenames:
        # Check if the file extension isn't .png or .jpg.
        if TODO:
            num_non_photo_files += 1
            continue  # Skip to the next filename.

        # Open image file using Pillow.

        # Check if the width & height are larger than 500.
        if TODO:
            # Image is large enough to be considered a photo.
            num_photo_files += 1
        else:
            # Image is too small to be a photo.
            num_non_photo_files += 1

    # If more than half of files were photos,
    # print the absolute path of the folder.
    if TODO:
        print(TODO)
When the program runs, it should print the absolute path of any photo folders to the screen.
Creating Custom Seating Cards
In a practice program in Chapter 17, you created custom invitations from a list of guests in a plaintext file. As an additional project, use Pillow to create images that will serve as custom seating cards for your guests. For each of the guests listed in the guests.txt file from the book’s online resources, generate an image file with the guest’s name and some flowery decoration. A public domain flower image is also available in the book’s resources.
To ensure that each seating card is the same size, add a black rectangle to the edges of the invitation image; that way, when you print the image, you’ll have a guideline for cutting. The PNG files that Pillow produces are set to 72 pixels per inch, so a 4×5-inch card would require a 288×360-pixel image.