Check out other books by Al Sweigart, free online or available for purchase:
...and other books as well! Or register for the online video course. You can also donate to support the author directly.
5 DEBUGGING
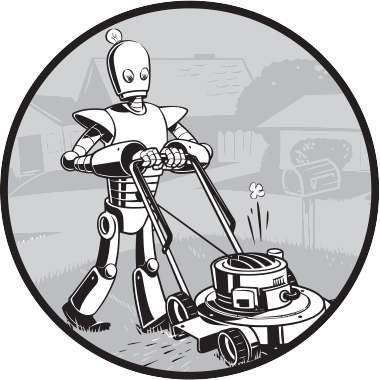
Now that you know enough to write basic programs, you may start finding not-so- simple bugs in them. This chapter covers some tools and techniques for finding the root cause of bugs in your program to help you fix them more quickly and with less effort. To paraphrase an old joke among programmers, writing code accounts for 90 percent of programming. Debugging code accounts for the other 90 percent.
Your computer will do only what you tell it to do; it won’t read your mind and do what you intended it to do. Even professional programmers create bugs all the time, so don’t feel discouraged if your program has a problem.
Fortunately, a few tools and techniques can identify exactly what your code is doing and where it’s going wrong. You’ll use the debugger, a feature of Mu that executes a program one instruction at a time, giving you a chance to inspect the values in variables while your code runs, and track how the values change over the course of your program. This process is much slower than running the program at full speed, but it allows you to see the actual values in a program while it runs, rather than having to deduce what the values might be from the source code.
You’ll also make your programs raise custom exceptions to indicate errors, and you’ll learn about logging and assertions, two features that can help you detect bugs early. In general, the earlier you catch bugs, the easier they will be to fix.
Raising Exceptions
Python raises an exception whenever it tries to execute invalid code. In Chapter 4, you handled Python’s exceptions with try and except statements so that your program could recover from exceptions you anticipated. But you can also raise your own exceptions in your code. Raising an exception is a way of saying, “Stop running this code, and move the program execution to the except statement.”
We raise exceptions with a raise statement, which consists of the following:
- The raise keyword
- A call to the Exception() function
- A string with a helpful error message passed to the Exception() function
For example, enter the following into the interactive shell:
>>> raise Exception('This is the error message.')
Traceback (most recent call last):
  File "<pyshell#191>", line 1, in <module>
    raise Exception('This is the error message.')
Exception: This is the error message.
If no try and except statements cover the raise statement that raised the exception, the program simply crashes and displays the exception’s error message.
Often, it’s the code that calls the function containing a raise statement, rather than the function itself, that knows how to handle an exception. That means you’ll commonly see a raise statement inside a function, and the try and except statements in the code calling the function. For example, open a new file editor tab, enter the following code, and save the program as boxPrint.py:
def box_print(symbol, width, height):
    if len(symbol) != 1:
      ❶ raise Exception('Symbol must be a single character string.')
    if width <= 2:
      ❷ raise Exception('Width must be greater than 2.')
    if height <= 2:
      ❸ raise Exception('Height must be greater than 2.')

    print(symbol * width)
    for i in range(height - 2):
        print(symbol + (' ' * (width - 2)) + symbol)
    print(symbol * width)

try:
    box_print('*', 4, 4)
    box_print('O', 20, 5)
    box_print('x', 1, 3)
    box_print('ZZ', 3, 3)
❹ except Exception as err:
  ❺ print('An exception happened: ' + str(err))
try:
    box_print('ZZ', 3, 3)
except Exception as err:
    print('An exception happened: ' + str(err))
Here, we’ve defined a box_print() function that takes a character, a width, and a height, and uses the character to make a little picture of a box with that width and height. This box shape is printed to the screen.
Say we want the function to accept a single character only, and we expect the width and height to be greater than 2. We add if statements to raise exceptions if these requirements aren’t satisfied. Later, when we call box _print() with various arguments, our try-except will handle invalid arguments.
This program uses the except Exception as err form of the except statement ❹. If an Exception object is returned from box_print() ❶ ❷ ❸, this except statement will store it in a variable named err. We can then convert the Exception object to a string by passing it to str() to produce a user-friendly error message ❺. When you run this boxPrint.py, the output will look like this:
****
*  *
*  *
****
OOOOOOOOOOOOOOOOOOOO
O                  O
O                  O
O                  O
OOOOOOOOOOOOOOOOOOOO
An exception happened: Width must be greater than 2.
An exception happened: Symbol must be a single character string.
Using the try and except statements, you can handle errors gracefully, rather than letting the entire program crash.
Assertions
An assertion is a sanity check to make sure your code isn’t doing something obviously wrong. We perform these sanity checks with assert statements. If the sanity check fails, the code raises an AssertionError exception. An assert statement consists of the following:
- The assert keyword
- A condition (that is, an expression that evaluates to True or False)
- A comma
- A string to display when the condition is False
In plain English, an assert statement says, “I assert that the condition holds true, and if not, there is a bug somewhere, so immediately stop the program.” For example, enter the following into the interactive shell:
>>> ages = [26, 57, 92, 54, 22, 15, 17, 80, 47, 73]
>>> ages.sort()
>>> ages
[15, 17, 22, 26, 47, 54, 57, 73, 80, 92]
>>> assert ages[0] <= ages[-1]  # Assert that the first age is <= the last age.
The assert statement here asserts that the first item in ages should be less than or equal to the last one. This is a sanity check; if the code in sort() is bug-free and did its job, then the assertion would be true. Because the ages[0] <= ages[-1] expression evaluates to True, the assert statement does nothing.
However, let’s pretend we had a bug in our code. Say we accidentally called the reverse() list method instead of the sort() list method. When we enter the following in the interactive shell, the assert statement raises an AssertionError:
>>> ages = [26, 57, 92, 54, 22, 15, 17, 80, 47, 73]
>>> ages.reverse()
>>> ages
[73, 47, 80, 17, 15, 22, 54, 92, 57, 26]
>>> assert ages[0] <= ages[-1]  # Assert that the first age is <= the last age.
Traceback (most recent call last):
  File "<python-input-0>", line 1, in <module>
AssertionError
Unlike exceptions, your code should not handle assert statements with try and except; if an assert fails, your program should crash. By “failing fast” like this, you shorten the time between the original cause of the bug and the moment you first notice it, reducing the amount of code you’ll have to check before finding the bug’s cause.
Assertions are for programmer errors, not user errors. Assertions should fail only while the program is under development; a user should never see an assertion error in a finished program. For errors that your program can encounter as a normal part of its operation (such as a file not being found or the user entering invalid data), raise an exception instead of detecting it with an assert statement.
Logging
If you’ve ever put a print() function in your code to output some variable’s value while your program is running, you’ve used a form of logging to debug your code. Logging is a great way to understand what’s happening in your program and in what order it’s happening. Python’s logging module makes it easy to create a record of custom messages that you write. These log messages will describe when the program execution has reached the logging function call and will list any variables you’ve specified at that point in time, providing a trail of breadcrumbs that can help you figure out when things started to go wrong. On the other hand, a missing log message indicates a part of the code was skipped and never executed.
The logging Module
To enable the logging module to display log messages on your screen as your program runs, copy the following to the top of your program:
import logging
logging.basicConfig(level=logging.DEBUG, format=' %(asctime)s -  %(levelname)s -  %(message)s')
The logging module’s basicConfig() function lets you specify what details you want to see and how you want those details displayed.
Say you wrote a function to calculate the factorial of a number. In mathematics, the factorial of 4 is 1 × 2 × 3 × 4, or 24. The factorial of 7 is 1 × 2 × 3 × 4 × 5 × 6 × 7, or 5,040. Open a new file editor tab and enter the following code. It has a bug in it, but you’ll generate several log messages to help figure out what’s going wrong. Save the program as factorialLog.py:
import logging
logging.basicConfig(level=logging.DEBUG, format='%(asctime)s -  %(levelname)s -  %(message)s')
logging.debug('Start of program')

def factorial(n):
    logging.debug('Start of factorial(' + str(n) + ')')
    total = 1
    for i in range(n + 1):
        total *= i
        logging.debug('i is ' + str(i) + ', total is ' + str(total))
    logging.debug('End of factorial(' + str(n) + ')')
    return total

print(factorial(5))
logging.debug('End of program')
We use the logging.debug() function to print log information. This debug() function calls basicConfig(), which prints a line of information in the format we specified in the function call, along with the messages we passed to debug(). The print(factorial(5)) call is part of the original program, so the code displays the result even if logging messages are disabled.
The output of this program looks like this:
2035-05-23 16:20:12,664 - DEBUG - Start of program
2035-05-23 16:20:12,664 - DEBUG - Start of factorial(5)
2035-05-23 16:20:12,665 - DEBUG - i is 0, total is 0
2035-05-23 16:20:12,668 - DEBUG - i is 1, total is 0
2035-05-23 16:20:12,670 - DEBUG - i is 2, total is 0
2035-05-23 16:20:12,673 - DEBUG - i is 3, total is 0
2035-05-23 16:20:12,675 - DEBUG - i is 4, total is 0
2035-05-23 16:20:12,678 - DEBUG - i is 5, total is 0
2035-05-23 16:20:12,680 - DEBUG - End of factorial(5)
0
2035-05-23 16:20:12,684 - DEBUG - End of program
The factorial() function returns 0 as the factorial of 5, which isn’t right. The for loop should be multiplying the value in total by the numbers from 1 to 5, but the log messages displayed by logging.debug() show that the i variable starts at 0 instead of 1. Since zero times anything is zero, the rest of the iterations have the wrong value for total.
Change the for i in range(n + 1): line to for i in range(1, n + 1):, and run the program again. The output will look like this:
2035-05-23 17:13:40,650 - DEBUG - Start of program
2035-05-23 17:13:40,651 - DEBUG - Start of factorial(5)
2035-05-23 17:13:40,651 - DEBUG - i is 1, total is 1
2035-05-23 17:13:40,654 - DEBUG - i is 2, total is 2
2035-05-23 17:13:40,656 - DEBUG - i is 3, total is 6
2035-05-23 17:13:40,659 - DEBUG - i is 4, total is 24
2035-05-23 17:13:40,661 - DEBUG - i is 5, total is 120
2035-05-23 17:13:40,661 - DEBUG - End of factorial(5)
120
2035-05-23 17:13:40,666 - DEBUG - End of program
The factorial(5) call correctly returns 120. The log messages showed what was going on inside the loop, which led straight to the bug.
You can see that the logging.debug() calls printed out not just the strings passed to them but also a timestamp and the word DEBUG.
Logfiles
Instead of displaying the log messages to the screen, you can write them to a text file. The logging.basicConfig() function takes a filename named parameter, like so:
import logging
logging.basicConfig(filename='myProgramLog.txt', level=logging.DEBUG,
format=' %(asctime)s -  %(levelname)s -  %(message)s')
This code will save the log messages to myProgramLog.txt.
While logging messages are helpful, they can clutter your screen and make it hard to read the program’s output. Writing the logging messages to a file will keep your screen clear and enable you to read the messages after running the program. You can open this text file in any text editor, such as Notepad or TextEdit.
A Poor Practice: Debugging with print()
Entering import logging and logging.basicConfig(level=logging.DEBUG, format= '%(asctime)s - %(levelname)s - %(message)s') is somewhat unwieldy. You may want to use print() calls instead, but don’t give in to this temptation! Once you’re done debugging, you’ll end up spending a lot of time removing print() calls from your code for each log message. You might even accidentally remove some print() calls that were used for non-log messages. The nice thing about log messages is that you’re free to fill your program with as many as you like, and can always disable them later by adding a single logging.disable(logging.CRITICAL) call. Unlike print(), the logging module makes it easy to switch between showing and hiding log messages.
Log messages are intended for the programmer, not the user. The user won’t care about the contents of some dictionary value you need to see to help with debugging; use a log message for something like that. For error messages that the user should see, like File not found or Invalid input, please enter a number, use a print() call. You don’t want to deprive the user of helpful information they can use to solve their problem.
Logging Levels
Logging levels provide a way to categorize your log messages by importance so that you can filter less important messages while testing your programs. There are five logging levels, described in Table 5-1 from least to most important. Your program can log messages at each level using different logging functions.
Level |
Logging function |
Description |
|---|---|---|
DEBUG |
logging.debug() |
The lowest level, used for small details. Usually, you’ll care about these messages only when diagnosing problems. |
INFO |
logging.info() |
Used to record information about general events in your program or to confirm that it’s working at various points. |
WARNING |
logging.warning() |
Used to indicate a potential problem that doesn’t prevent the program from working but might do so in the future. |
ERROR |
logging.error() |
Used to record an error that caused the program to fail to do something. |
CRITICAL |
logging.critical() |
The highest level, used to indicate a fatal error that has caused, or is about to cause, the program to stop running entirely. |
Ultimately, it’s up to you to decide which category your log message falls into. You can pass the log message to these functions as a string. Try this yourself by entering the following into the interactive shell:
>>> import logging
>>> logging.basicConfig(level=logging.DEBUG, format=' %(asctime)s -
%(levelname)s -  %(message)s')
>>> logging.debug('Some minor code and debugging details.')
2035-05-18 19:04:26,901 - DEBUG - Some debugging details.
>>> logging.info('An event happened.')
2035-05-18 19:04:35,569 - INFO - The logging module is working.
>>> logging.warning('Something could go wrong.')
2035-05-18 19:04:56,843 - WARNING - An error message is about to be logged.
>>> logging.error('An error has occurred.')
2035-05-18 19:05:07,737 - ERROR - An error has occurred.
>>> logging.critical('The program is unable to recover!')
2035-05-18 19:05:45,794 - CRITICAL - The program is unable to recover!
The benefit of logging levels is that you can change the priority of the logging messages you want to see. Passing logging.DEBUG to the basicConfig() function’s level named parameter will show messages from all the logging levels (DEBUG being the lowest level). But after developing your program some more, you may be interested only in errors. In that case, you can set basicConfig()’s level argument to logging.ERROR. This will show only ERROR and CRITICAL messages and will skip the DEBUG, INFO, and WARNING messages.
Disabled Logging
After you’ve debugged your program, you probably don’t want all these log messages cluttering the screen. The logging.disable() function disables these so that you don’t have to remove the logging calls by hand. Simply pass a logging level to logging.disable() to suppress all log messages at that level or lower. To disable logging entirely, add logging.disable(logging.CRITICAL) to your program. For example, enter the following into the interactive shell:
>>> import logging
>>> logging.basicConfig(level=logging.INFO, format=' %(asctime)s -
%(levelname)s -  %(message)s')
>>> logging.critical('Critical error! Critical error!')
2035-05-22 11:10:48,054 - CRITICAL - Critical error! Critical error!
>>> logging.disable(logging.CRITICAL)
>>> logging.critical('Critical error! Critical error!')
>>> logging.error('Error! Error!')
Because logging.disable() will disable all messages after it, you’ll probably want to add it near the import logging line of code in your program. This way, you can easily find it to comment out or uncomment that call to enable or disable logging messages as needed.
Mu’s Debugger
The debugger is a feature of the Mu editor, IDLE, and other editor software that allows you to execute your program one line at a time. The debugger will run a single line of code and then wait for you to tell it to continue. By running your program “under the debugger” like this, you can take as much time as you want to examine the values in the variables at any given point during the program’s lifetime. This is a valuable tool for tracking down bugs.
To run a program under Mu’s debugger, click the Debug button in the top row of buttons, next to the Run button. The Debug Inspector pane should open in the right side of the window. This pane lists the current value of variables in your program. In Figure 5-1, the debugger has paused the execution of the program just before it would have run the first line of code. You can see this line highlighted in the file editor.
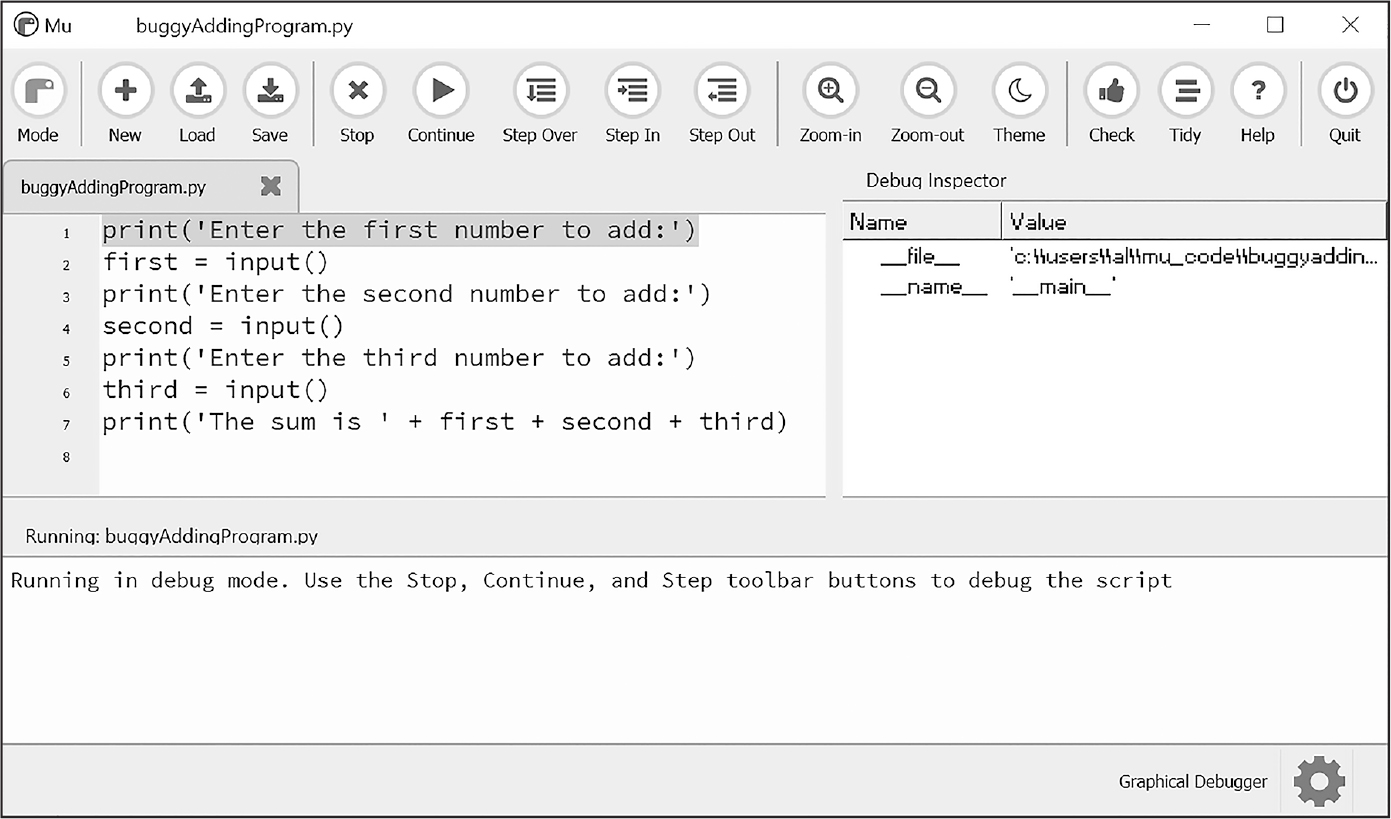
Figure 5-1: Mu running a program under the debugger Description
Debugging mode also adds the following new buttons to the top of the editor: Continue, Step Over, Step In, and Step Out. The usual Stop button is also available.
Clicking the Continue button will cause the program to execute normally until it terminates or reaches a breakpoint. (I’ll describe breakpoints later in this chapter.) If you’re done debugging and want the program to continue normally, click the Continue button.
Clicking the Step In button will cause the debugger to execute the next line of code and then pause again. If the next line of code is a function call, the debugger will step into that function, jumping to the function’s first line of code.
Clicking the Step Over button will execute the next line of code, similar to the Step In button. However, if the next line of code is a function call, the Step Over button will step over, or rush through, the code in the function. The function’s code will execute at full speed, and the debugger will pause as soon as the function call returns. For example, if the next line of code calls a spam() function but you don’t really care about code inside this function, you can click Step Over to execute the code in the function at normal speed, and then pause when the function returns. For this reason, using the Step Over button is more common than using the Step In button.
Clicking the Step Out button will cause the debugger to execute lines of code at full speed until it returns from the current function. If you’ve stepped into a function call with the Step In button and now simply want to keep executing instructions until you leave it, click the Step Out button to step out of the current function call.
If you want to stop debugging entirely and not bother to continue executing the rest of the program, click the Stop button. The Stop button will immediately terminate the program.
Debugging an Addition Program
To practice using the Mu debugger, open a new file editor tab and enter the following code:
print('Enter the first number to add:')
first = input()
print('Enter the second number to add:')
second = input()
print('Enter the third number to add:')
third = input()
print('The sum is ' + first + second + third)
Save it as buggyAddingProgram.py and run it first without the debugger enabled. The program will output something like this:
Enter the first number to add:
5
Enter the second number to add:
3
Enter the third number to add:
42
The sum is 5342
The program hasn’t crashed, but the sum is obviously wrong.
Run the program again, this time under the debugger. Click the Debug button, and the program should pause on line 1, which is the code it’s about to execute.
Click the Step Over button once to execute the first print() call. You should use Step Over instead of Step In here because you don’t want to step into the code for the print() function (although Mu should prevent the debugger from entering Python’s built-in functions). The debugger moves on to line 2, and highlights line 2 in the file editor, as shown in Figure 5-2. This shows you where the program execution currently is.

Figure 5-2: The Mu editor window after clicking Step Over Description
Click Step Over again to execute the input() function call. The highlighting will go away while Mu waits for you to type something for the input() call into the output pane. Enter 5 and press ENTER. The highlighting will return.
Keep clicking Step Over, and enter 3 and 42 as the next two numbers. When the debugger reaches line 7, the final print() call in the program, the Mu editor window should look like Figure 5-3.

Figure 5-3: The Debug Inspector pane, located on the right side of the Mu editor window, shows that the variables are set to strings instead of integers, causing the bug. Description
In the Debug Inspector pane, you should see that the first, second, and third variables are set to string values '5', '3', and '42' instead of integer values 5, 3, and 42. When the last line is executed, Python concatenates these strings instead of adding the numbers together, causing the bug.
Stepping through the program with the debugger is helpful but can also be slow. Often, you’ll want the program to run normally until it reaches a certain line of code. You can configure the debugger to do this with breakpoints.
Setting Breakpoints
Setting a breakpoint on a specific line of code forces the debugger to pause whenever the program execution reaches that line. Open a new file editor tab and enter the following program, which simulates flipping a coin 1,000 times. Save it as coinFlip.py:
import random
heads = 0
for i in range(1, 1001):
  ❶ if random.randint(0, 1) == 1:
        heads = heads + 1
    if i == 500:
      ❷ print('Halfway done!')
print('Heads came up ' + str(heads) + ' times.')
The random.randint(0, 1) call ❶ will return 0 half of the time and 1 the other half of the time, simulating a 50/50 coin flip where 1 represents heads. When you run this program without the debugger, it quickly outputs something like the following:
Halfway done!
Heads came up 490 times.
If you ran this program under the debugger, you would have to click the Step Over button thousands of times before the program terminated. If you were interested in the value of heads at the halfway point of the program’s execution, when 500 of 1,000 coin flips have been completed, you could instead just set a breakpoint on the line print('Halfway done!') ❷. To set a breakpoint, click the line number in the file editor. This should cause a red dot to appear, marking the breakpoint; see Figure 5-4.

Figure 5-4: Setting a breakpoint causes a red dot (circled) to appear next to the line number.
Note that you wouldn’t want to set a breakpoint on the if statement line, as the if statement executes on every single iteration through the loop. When you set the breakpoint on the code in the if statement, the debugger breaks only when the execution enters the if clause.
Now when you run the program under the debugger, it should start in a paused state at the first line, as usual, but if you click Continue, the program should run at full speed until it reaches the line with the breakpoint set on it. You can then click Continue, Step Over, Step In, or Step Out to continue as normal.
If you want to remove a breakpoint, click the line number again. The red dot will go away, and the debugger won’t break on that line in the future.
Summary
Assertions, exceptions, logging, and the debugger are all valuable tools to find and prevent bugs in your program. Assertions with the Python assert statement are a good way to implement “sanity checks” that give you an early warning when a necessary condition doesn’t hold true. Assertions are only for errors that the program shouldn’t try to recover from, and they should fail fast. Otherwise, you should raise an exception.
An exception can be caught and handled by the try and except statements. The logging module is a good way to look into your code while it’s running, and it is much more convenient to use than the print() function because of its different logging levels and its ability to log to a text file.
The debugger lets you step through your program one line at a time. Alternatively, you can run your program at normal speed and have the debugger pause execution whenever it reaches a line with a breakpoint set. Using the debugger, you can see the state of any variable’s value at any point during the program’s lifetime.
Accidentally introducing bugs into your code is a fact of life, no matter how many years of coding experience you have. These debugging tools and techniques will help you write programs that work.
Practice Questions
1. Write an assert statement that triggers an AssertionError if the variable spam is an integer less than 10.
2. Write an assert statement that triggers an AssertionError if the variables eggs and bacon contain strings that are the same as each other, even if their cases are different. (That is, 'hello' and 'hello' are considered the same, as are 'goodbye' and 'GOODbye'.)
3. Write an assert statement that always triggers an AssertionError.
4. What two lines must your program have to be able to call logging.debug()?
5. What two lines must your program have to make logging.debug() send a logging message to a file named programLog.txt?
6. What are the five logging levels?
7. What line of code can you add to disable all logging messages in your program?
8. Why is using logging messages better than using print() to display the same message?
9. What are the differences between the Step Over, Step In, and Step Out buttons in the debugger?
10. After you click Continue, when will the debugger stop?
11. What is a breakpoint?
12. How do you set a breakpoint on a line of code in Mu?
Practice Program: Debugging Coin Toss
The following program is meant to be a simple coin toss guessing game. The player gets two guesses. (It’s an easy game.) However, the program has multiple bugs in it. Run through the program a few times to find the bugs that keep the program from working correctly.
import random
guess = ''
while guess not in ('heads', 'tails'):
    print('Guess the coin toss! Enter heads or tails:')
    guess = input()
toss = random.randint(0, 1)  # 0 is tails, 1 is heads
if toss == guess:
    print('You got it!')
else:
    print('Nope! Guess again!')
    guess = input()
    if toss == guess:
        print('You got it!')
    else:
        print('Nope. You are really bad at this game.')